


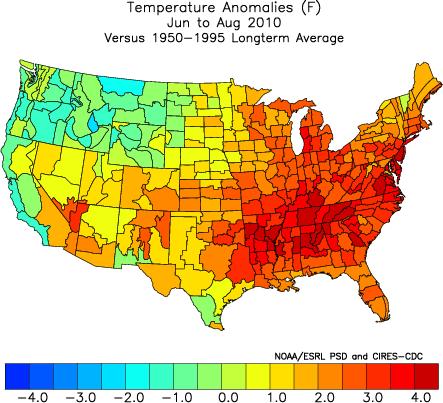
Washington DC and many cities of the east and south had a warm to record warm summer (while parts of the west had a cold to record cold) with the average for the nation the 4th warmest on record. For Washington, it broke many of the records set in 1980 and 1988. It tied with the number of 90F days set in 1988 and fell just 12 days short of the number of 90F days for the year (a few additional still possible) set in 1980.
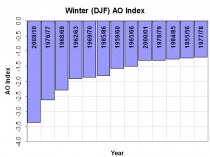
A hot summer is very typical when a strong La Nina follows a strong El Nino winter (1999, 1988, 1966) or when record strong arctic blocking in winter fades (1977). This past winter we saw a record for negative Arctic Oscillation (AO) beating out 1976/77 and 1965/66 (below, enlarged here).
The summer was 2.2F above normal for the nation, ranking it as fourth warmest (below, enlarged here).

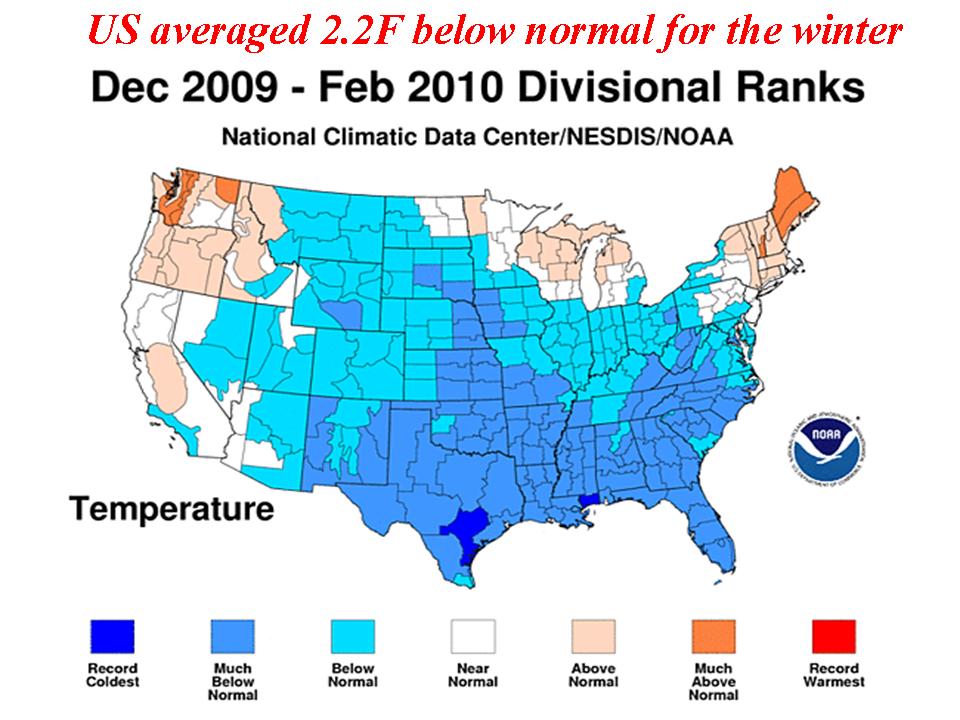
That matches how much last winter the US averaged below normal (2.2F). Last winter was coldest in the south and southeast (in a few spots, coldest ever). Colder to the south of DC but recall DC and surroundings had a record seasonal snowfall (below, enlarged here).

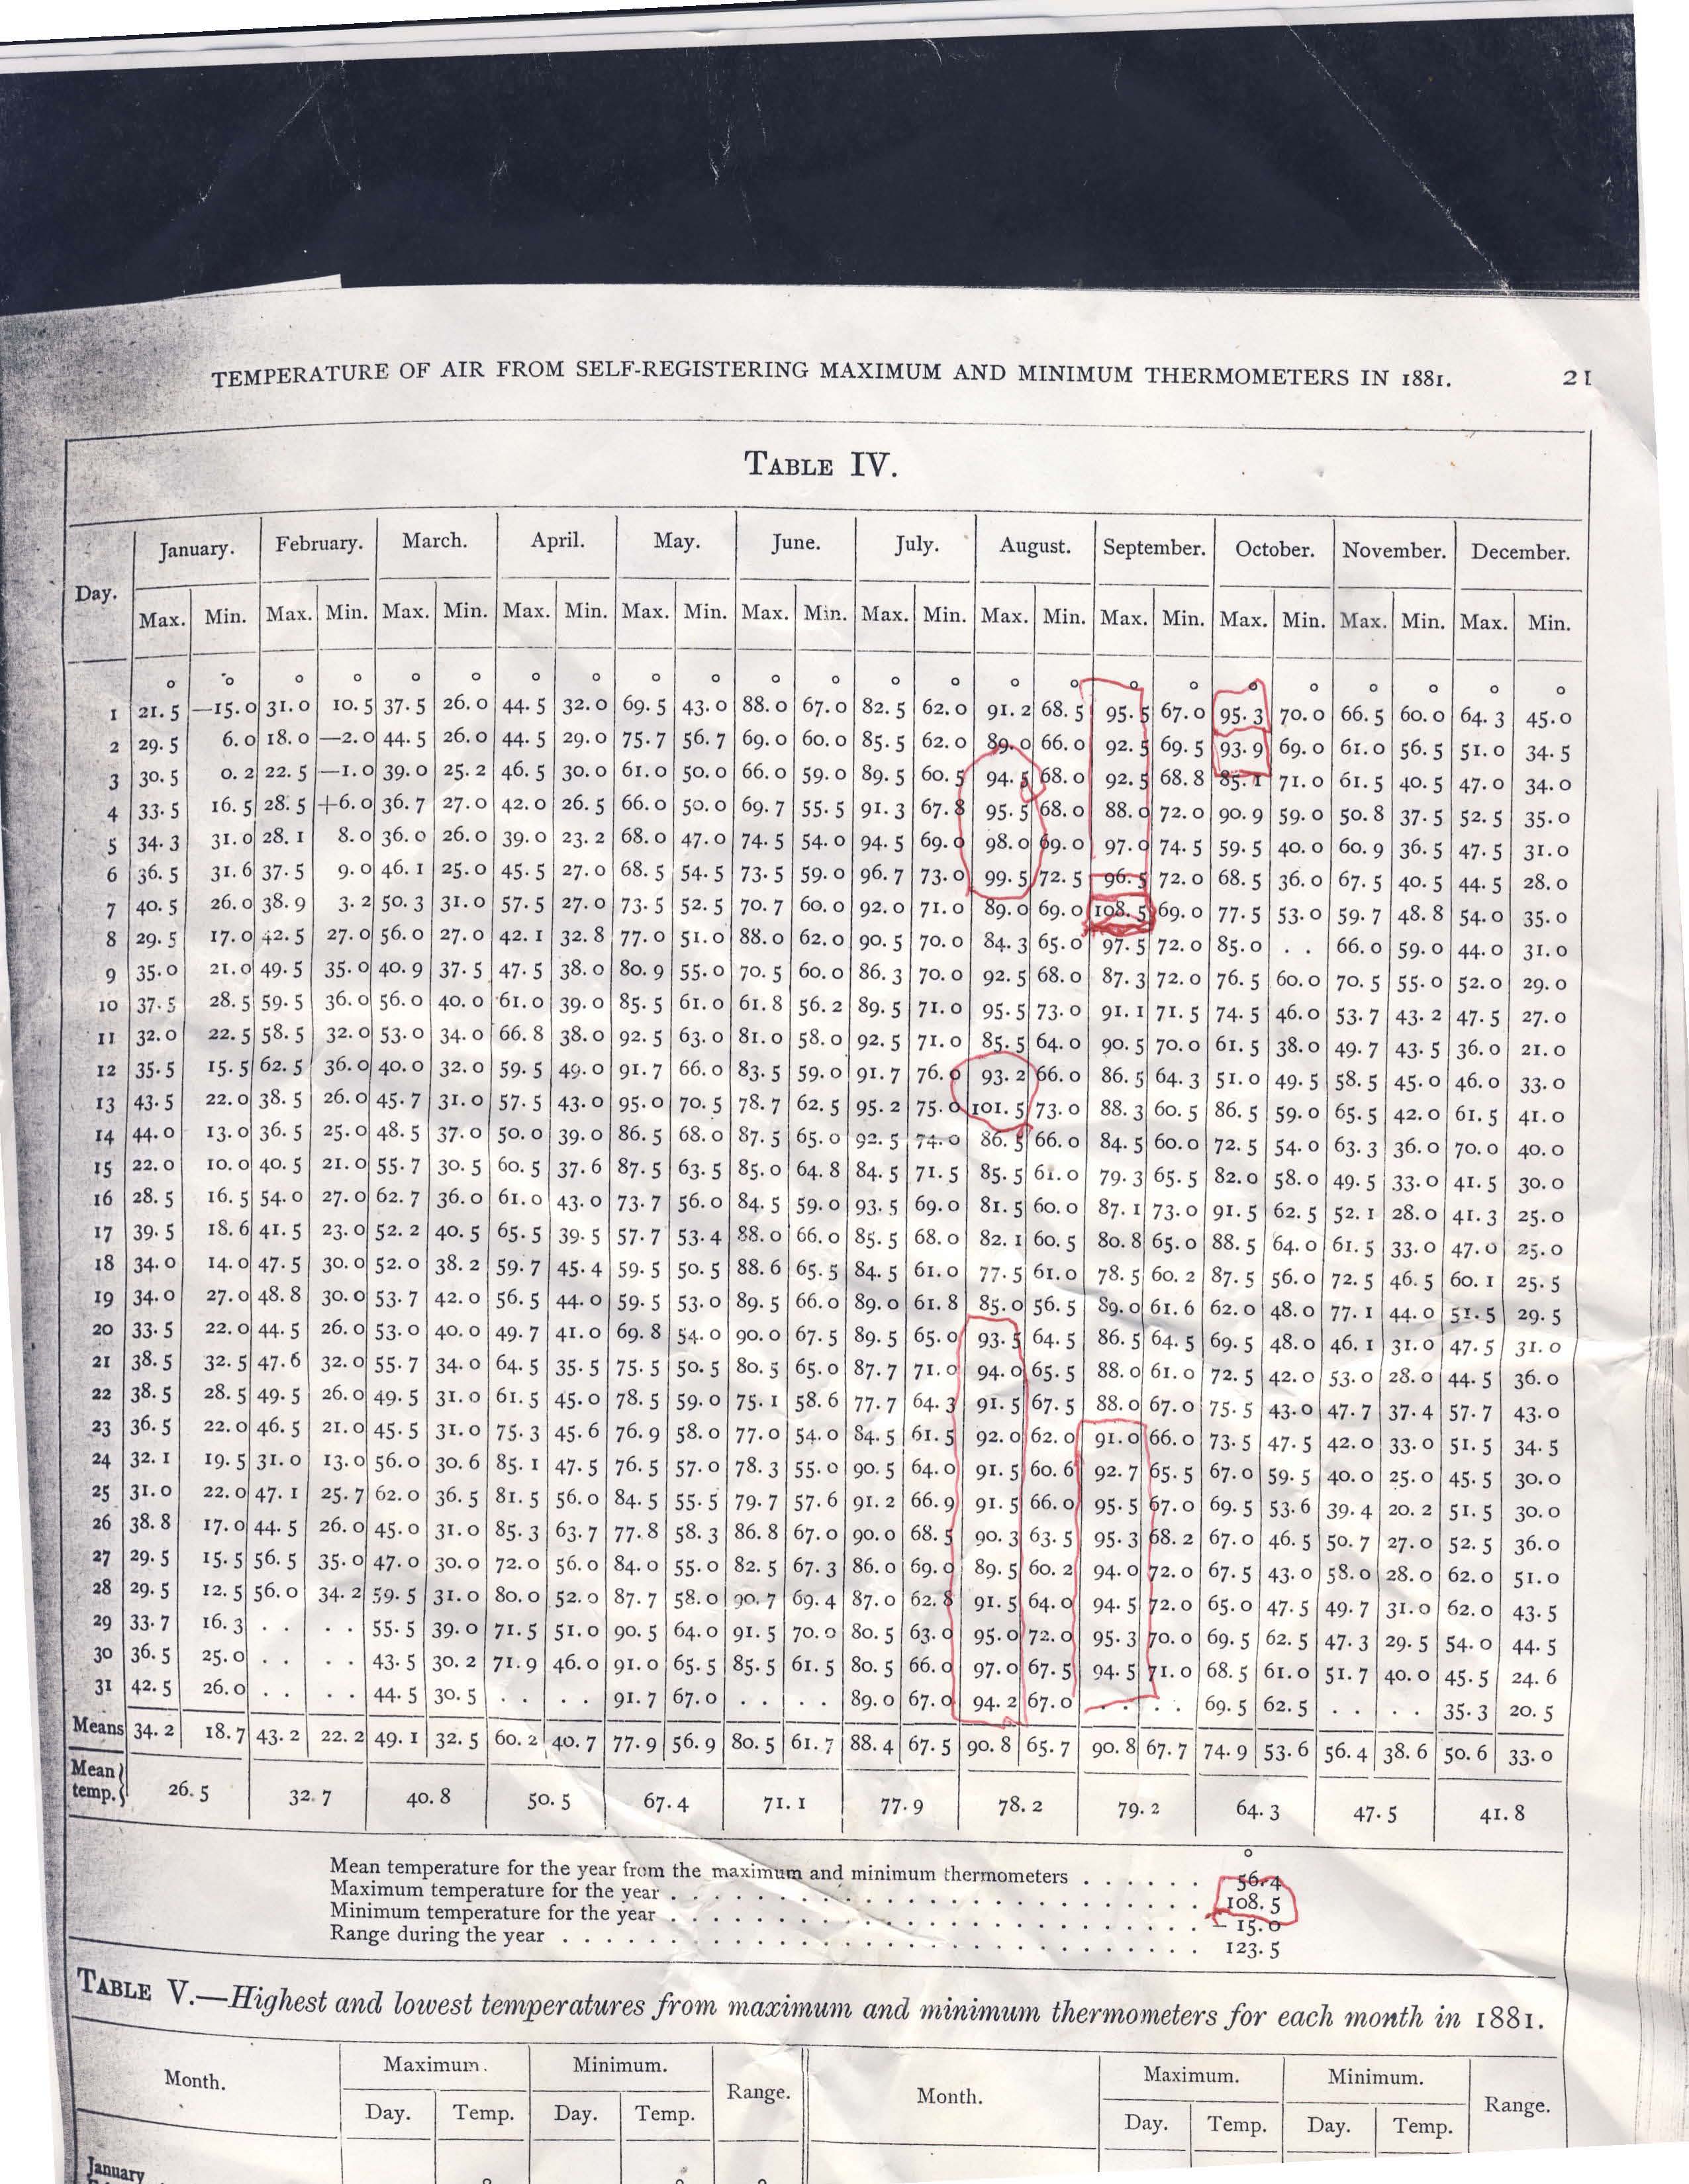
Besides 1980, 1988, other hot summers included 1881, where this record from “Andy” out of the Naval Observatory shows an amazing summer following a very cold January/winter. He writes:
I am attaching a rather rare document, Washington DC weather records for the year 1881 taken at the Naval Observatory.
I have highlighted an incredible late summer, early autumn heat wave that got started on August 20th and did not really end until October 4th. There has never been anything remotely approaching the intensity and duration of this heat wave for so late in the year in modern times.
An unbelievable temperature of 108.5 was recorded on the very late date of September 7th! Also the average September average high temperature of 90.8 dwarfs anything you can find in recent years. One could argue that the site or thermometer might reflect a warm bias. Examining the data, June was actually quite cool and July was about average. And back then, no one was pushing an agenda!
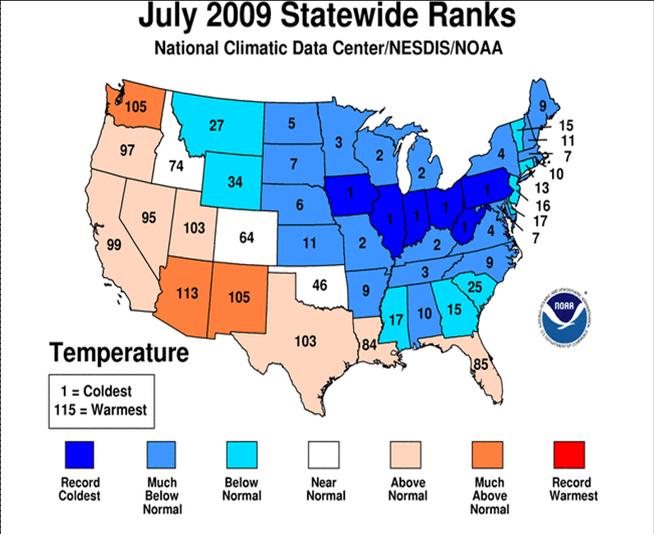
The summer this year was characterized by hot days with high humidities and thus very warm nights. Nighttime lows were especially above the normal. Ironically many of the same areas with warmth this summer had very cool summers the last two years with a record/near record cold July in 2009 (below, enlarged here).

That was consistent with a summer after a La Nina winter, one with low solar and high latitude volcanic activity. Last summer and last winter we were told that was weather not climate. This makes any claims that a hot summer this year is indicative of a warming world disengenuous. With La Nina coming on, look for a cool summer again next year. With a negative PDO look for colder years ahead. This will accelerate when the Atlantic cools. The active hurricane season will remove some of the heat built up in the Atlantic by the El Nino suppressed activity last year and reduced winds (mixing) and increased sunshine with a suppressed jet stream, weakened suppresed subtropical high pressure due to record blocking this past winter.
--------------------
NOAA outsources climate data management
Anthony Watts, Watts Up With That
No mention in this press release of what it might actually accomplish. Meanwhile a full scale siting assessment and quality control analysis of the entire NWS COOP network remains undone. On the plus side, they won’t now be able to use the CRU excuse of “we are understaffed” to avoid the FOIA requests surely coming their way. h/t to Joe DAleo/John Coleman - Anthony
Contact: John Leslie FOR IMMEDIATE RELEASE
301-713-0214 Sept. 16, 2010
NOAA Awards Contract to Manage Climate Data Records
NOAA officials today announced that Global Science & Technology, Inc., of Greenbelt, Md., has been awarded a contract to help manage the agency’s satellite Climate Data Records (CDR) program, which is based at NOAA’s National Climatic Data Center in Asheville, N.C.
The contract has a one-year base period, with two one-year option periods. The total contract value is $10,307,788.80. The contract will enable Global Science & Technology to add up to 25 jobs at NCDC’s Asheville location.
Scientists use CDRs to detect, assess, model and predict climate change and variability. Decision-makers use this information to develop effective strategies to adapt to and mitigate the impacts of climate change in their local communities.
Through this contract, Global Science & Technology, Inc. will provide management support of the CDR program, including project control and oversight services, system and product development, and customer and community outreach.
“Global Science & Technology, Inc. brings experience as an industry leader to the CDR program, which is developing some of the most important climate data products in the world,” said Scott Hausman, acting director of NOAA’s NCDC.
Commenter Billyquiz says:
September 17, 2010 at 9:21 am
“At our 2008 corporate retreat, GST decided to embrace a “green” philosophy to address our dependence on petroleum (as both a company and as individual employees) and the threat that global warming has to life on Earth.” Gatekeeping anyone?
NOAA’s NCDC is the largest environmental data center in the world. NCDC data help the scientific community and policymakers assess global climate variability and trends. The work on this contract will support the suite of climate services that NOAA provides government, business and community leaders, so they can make informed decisions.
“This is a remarkable opportunity for the National Climatic Data Center and for western North Carolina to expand our climate research and create up to 25 new high-paying, stable jobs in our area,” said Rep. Heath Shuler. “NCDC is home to the world’s most impressive and comprehensive collection of climate data, and this is one more step forward in making our mountain region unsurpassed in climate research in America.”
Scientists, researchers and leaders in government and industry use monthly U.S. and global temperature reports from NCDC to help track trends and other changes in the world’s climate. These climate services have a wide range of practical uses, from helping farmers know what and when to plant, to guiding resource managers with critical decisions about water, energy and other vital assets.
NOAA’s mission is to understand and predict changes in the Earth’s environment, from the depths of the ocean to the surface of the sun, and to conserve and manage our coastal and marine resources.
Commenter Mike Haseler says:
September 17, 2010 at 9:38 am
In the UK, government statistics are normally outsourced when they want to avoid things like FOI law and being subject to parliamentary scrutiny...it also makes it a lot easier for the next administration just to dump the whole thing!
See more comments here.
By S. Fred Singer, President, Science and Environmental Policy Project
“The Hockey Stick Illusion: Climategate and the Corruption of Science.” By A.W. Montford. Stacey International. London. 2010. 482pp.
Andrew Montford, a Scot, blogs under the name of Bishop Hill. I have not met him personally, but in correspondence with him I generally address him as Your Grace a bit of humor.
This is probably the best book about the Hockey Stick. And while some of the detail may be overwhelming to the innocent reader, it does present all of the relevant facts as far as I can tell. You will not only become an expert on tree rings, and get to know trees by their “first name,” so to speak, but you will also get to learn about difficult statistical concepts, such as “principal component analysis.” PCA is an important statistical technique and one which the originator of the Hockey Stick, Professor Michael Mann, apparently failed to fully grasp.
There is little one can add to Montford’s comprehensive account, so I will just supply some personal details. My own involvement in the hockey-stick affair is of no real consequence—and certainly not as important as that of the Canadians, Steven McIntyre and Ross McKitrick. They are the ones who “broke the Hockey Stick,” and Professor Edward Wegman of George Mason University, an expert statistician, provided the finishing touches.
I first learned of the Hockey Stick by reading the original paper by Mann, Bradley, and Hughes in Nature in 1998 and was surprised that it showed an extended decline of global (or NH) temperatures since the year 1000AD, until a sudden and major warming in the 20th century (the “blade” of the Hockey Stick). But providing some reassurance, there seemed to be good overlap between 1900 and 1980 with the instrumental record of Phil Jones, which showed a continuing rise in temperature from 1980 to the end of the century.
I had no basis to question the MBH work, but I noticed that the proxy record suddenly stopped in 1980 and did not extend beyond.
At that time, I was heavily influenced by the satellite data of Christy and Spencer that showed no atmospheric warming trend from 1979 to 1997—in contrast to Jones’ surface data from weather stations. Since Mann was using the Jones temperature data for calibration of the proxy record, I asked Mann if he had any post-1980 proxies. He replied rather brusquely that there were no suitable data available. This was my only exchange with Mann, and I’ve preserved those emails.
Of course, I did not believe Mann, since I knew of tree ring data (by Jacoby in 1996) that showed no temperature rise since 1940 (see figure 16 in my 1997 book Hot Talk Cold Science). I also knew that Dahl-Jensen’s ice cores showed no temperature rise since 1940. Hence I had doubts about the Jones dataand still do.
Following this unsatisfactory e-mail exchange with Mann, I had correspondence with McIntyre, Charles Keller, and others, trying to collect some post-1980 proxies to decide whether the Jones record was sound—and whether Mann had stopped his proxy record in 1980 because it did not agree with Jones. Today we know, thanks to Climategate, that this might have been “Mann’s Nature trick” in order to “hide the decline [of temperature].”
I visited Ed Cook at the Lamont Geophysical Laboratory to get post-1980 tree ring data, but was unsuccessful and finally gave up and turned to other matters. I also had a chance to speak briefly to Mann at the University of Virginia in Charlottesville, but could not extract any information from him. By then, he clearly regarded me as an ‘enemy’ and would not have given me anything of value.
My next encounter with the Hockey Stick was to review the IPCC’s 3rd Assessment draft report in 2000. In the draft, the Hockey Stick was represented along with the Jones instrumental record, using colors of black and blue. I prevailed on IPCC to use colors that were easily distinguishable and was glad to see the Jones record appearing in red in the final IPCC version.
My next encounter came in 2003 when the editor of Energy & Environment sent me the first of the McIntyre and McKitrick papers for review. I was surprised to learn of some half dozen or so cases where Mann had clearly mishandled the data, even substituting imaginary sequences to fill gaps where data were not available. Of course, I endorsed publication of this first of the M&M attacks on the Hockey Stick.
I also witnessed the encounter between Mann and McIntyre at the hearings arraigned by the National Academy (NAS), charged to write a report on the Hockey Stick. Tellingly, Mann presented a brief account of his work and then immediately walked out without taking any questions or listening to the McIntyre presentation. It was a thoroughly disappointing performance, particularly since some have misinterpreted the NAS report as an endorsement of the Hockey Stick. Actually, it was just the opposite, but it was misleading. The NAS stated that the 20th century was the warmest in the last 400 years, without making it clear that 400 years ago the earth was in the depth of the Little Ice Age.
It is certainly noteworthy that the IPCC in its fourth assessment report [2007] no longer displays the Hockey Stick. It had been demolished by able statisticians like Wegman and von Storch. M&M had shown in the meantime that random numbers fed into the Mann algorithm would always produce a hockey-stick-shaped result.
The “Last Hurrah” for the Hockey Stick came in 2009 in a report by the United Nations Environment Program. Apparently, UNEP wanted to dramatize matters before the crucial Dec 2009 Copenhagen meeting and brought back the Hockey Stick in an inexpertly written report on climate change. They called it an “update” of the IPCC, but I’m sure that responsible IPCC scientists would not have agreed with that characterization. When we inquired where their Hockey Stick graph originated, we were led to a Norwegian biologist who had republished a graph he had found in Wikipedia - too funny for words! UNEP immediately reissued their report and replaced their Hockey Stick graph with a less controversial one.
There is a serious matter, however, which bears discussion: Did Mann commit fraud? I would give him the benefit of the doubt and suggest that his initial Nature publication contained many errors, including major statistical ones, which he might not have been aware of. But certainly, after these errors had been pointed out to him in no uncertain terms, how could he maintain his original posture and claim that the Hockey Stick truly represented the global temperature record of the last 1000 years? All this in spite of many publications, both before and after 1998, that clearly told a different story: The compilation of temperature values by Soon and Baliunas, who were viciously attacked by the IPCC crowd; the isotope data of Cuffey; the global proxy data (omitting tree rings) of Loehle, which clearly showed the medieval warm period to be warmer than today; the deep-sea sediment record of Kegwin; and, of course, the historical record.
The Attorney General of the Commonwealth of Virginia, Kenneth Cuccinelli, is currently engaged in extracting from the University of Virginia (where Mann was a faculty member from 1999 to 2005) the e-mail records and other material relating to Mann. The University is fighting this demand in court yet it had already agreed some months ago to deliver the e-mail records of Patrick Michaels to Greenpeace! At that time, no cries of “academic freedom” were raised by the usual suspects. The silence then, and vociferous objections now expose the hypocrisy of the UVa Faculty Senate, the AAUP, the AAAS, and the Union of Concerned Scientists.
It is quite likely that Cuccinelli will discover a “smoking gun.” Perhaps some of the emails that Phil Jones admitted to having deleted might tell us just when Mann became himself aware that the Hockey Stick was bogus and a fraud. - -
Tom Nelson reports here.
Brrrr!
Peru is going through its coldest winter in 50 years and hundreds of people and thousands of animals have already died of hypothermia as temperatures have fallen to record -23C lows in the mountain villages. But while this year’s cold has been put down to a periodic La Niña phenomenom, scientists here are convinced the bigger picture in the Andes is of progressive climate change.
Retreating glaciers, wild fluctuations of temperatures, unseasonal weather patterns, unpredictable frosts and extreme weather events are all consistent with climate change models.
Global warming is ‘bulls--t,’ says Ryanair boss
Iceage Now
The scientific consensus is “horses--t”. In an interview with The Independent, the chief executive of Europe’s largest airline branded the scientific consensus that man-made pollution is heating the planet as “horses--t.”
Ryanair’s combative boss Michael O’Leary agreed the climate was changing but denied it was caused by man-made emissions of carbon dioxide. “Nobody can argue that there isn’t climate change. The climate’s been changing since time immemorial,” he said.
“It’s amazing the way the whole f---ing eco-warriors and the media have changed. It used to be global warming, but now, when global temperatures haven’t risen in the past 12 years, they say ‘climate change’.”
“Well, hang on, we’ve had an ice age. We’ve also had a couple of very hot spells during the Middle Ages, so nobody can deny climate change. But there’s absolutely no link between man-made carbon, which contributes less than 2pc of total carbon emissions [and climate change].”
“Scientists argue there is global warming because they wouldn’t get half of the funding they get now if it turns out to be completely bogus,” he said.
“The scientific community has nearly always been wrong in history anyway. In the Middle Ages, they were going to excommunicate Galileo because the entire scientific community said the Earth was flat… I mean, it is absolutely bizarre that the people who can’t tell us what the f---ing weather is next Tuesday can predict with absolute precision what the f---ing global temperatures will be in 100 years’ time. It’s horses--t.”
O’Leary mocked global warming campaigners, describing the United Nations as “one of the world’s most useless organisations”, its Intergovernmental Panel on Climate Change (IPCC) as “utter tosh”, and US politician Al Gore as someone who “couldn’t even get f---ing re-elected” after a boom.
Investors Business Daily Editorial
Eco-Extremism: A light bulb factory closes in Virginia as mandated fluorescents are made in China. It’s now a crime to make or ship for sale 75-watt incandescent bulbs in the European Union. Welcome to green hell.
Thomas Alva Edison was a genius credited with the invention of many things - the phonograph, the motion picture, the incandescent light bulb, global warming. That last credit was given by those who rank light bulbs right up there with the internal combustion engine as ravagers of the planet.
The General Electric light bulb factory in Winchester, Va., closed this month, a victim, along with its 200 employees, of a 2007 energy conservation measure passed by Congress that set standards essentially banning ordinary incandescents by 2014.
Just as they are by fuel-economy standards, consumers are denied choice and the freedom to evaluate any possible benefits on their own by the nanny state. Washington’s force and coercion are necessary because it seems the great unwashed can’t seem to see the benefits or ignore the risks of compact fluorescents, or CFLs.
In Europe, light bulbs are already a controlled substance. The 100-watt bulb was banned last year and the 75-watt became illegal as of Sept. 1.
Not surprisingly, incandescent light bulbs there quickly became a hot item, flying off the shelves while they were still available. Der Spiegel reported that German customers leave hardware stores with carts piled high with enough incandescent bulbs to last 20 years. Garages and attics throughout the Old World are full of them.
It’s said that CFL bulbs are more economical in the long run because they supposedly use up to 80% less energy than old-style bulbs and don’t burn out as quickly. Though we’re not fully convinced of these claims, we do know that CFL bulbs are more expensive, costing up to six times as much as equivalent incandescent bulbs. Because they are made of glass tubes twisted into a spiral, they also require more hand labor and therefore cost more.
Due to the expense, CFLs are made largely in China, where labor is cheaper and environmental regulations not so strict. As with wind turbine blades, we are creating plenty of green jobs - in the People’s Republic.
Despite governments’ effort to market them, CFLs are not necessarily better. Tests conducted by the London Telegraph found that using a single lamp to illuminate a room, an 11-watt CFL produced only 58% of the illumination of an equivalent 60-watt incandescent - even after a 10-minute warm-up that consumers have found necessary for CFLs to reach their full brightness.
Lack of light isn’t the only drawback. CFLs apparently are so dangerous, the European Commission has to warn consumers of the environmental hazards they pose. If one breaks, consumers are advised to air out rooms and avoid using vacuum cleaners to prevent exposure to the mercury in the bulbs.
You can’t just throw an old bulb out, either. It must be properly disposed of lest your bedroom or family room become a Superfund toxic waste site.
Mercury is considered by environmentalists to be among the most toxic of toxic substances and, yes, it is dangerous if ingested or handled over time. We’ve been warned that high concentrations in fish are dangerous to pregnant women. We’ve been told mercury in vaccines causes autism. So it’s safe in light bulbs?
As we’ve found out here with energy regulation and taxes, and the push for cap-and-trade, governments don’t care what people want. Nor do they weigh the costs, the benefits and the risks of this or that. Government must mandate what’s good for us under penalty of law.
We still have time, though, before the lights go out. Our phase-out doesn’t begin until Jan. 1, 2012 - coincidentally an election year. When New Zealand faced a similar ban two years ago, it became an election issue for the National Party, at the time in the minority against the ruling Labour government.
In November 2008, the newly elected National Party overturned the light-bulb ban. This should make a light go on over the heads of GOP strategists seeking another issue against the nanny state. How about standing for light, liberty and the pursuit of happiness? See editorial here.
--------------
Turning Off the (Incandescent) Light of Liberty
By Alan Caruba
What if the government banned air conditioning? What if flat-screen televisions were determined to use too much electricity and were ordered phased out of production? What if the use of all plastic grocery bags were banned? What if the incandescent light bulb, one of the greatest inventions of Thomas Edison in the 1870s was banned? Oh wait, it has been banned!
In a nation where the Medicare “reform” requires Americans to purchase health insurance they may not want and may not be able to afford, was rammed through Congress, what can stop the government from dictating just about any choice you have regarding any purchase you make? The answer? Nothing.
Only it would no longer be a Constitutional government, a nation of laws that reflect anything resembling the truth. The ban on incandescent light bulbs turns off the light of liberty throughout America.
Here are some truths to keep in mind. (1) Carbon dioxide (CO2) along with other “greenhouse gas emissions” does not cause global warming. (2) There is no global warming. (3) The Earth has gone through known warming and cooling cycles for millions of years. (4) The Earth is in a cooling cycle.
(5) Beginning January 1, 2012, government rules will make it impossible to purchase a 100-watt incandescent light bulb. After that, in time, all such light bulbs will be phased out leaving Americans with only dim, over-priced, mercury-filled light bulbs. And (6) they will be made overseas, primarily in China.
By 2012, by order of the government, Americans will no longer be able to purchase any incandescent light bulbs. Why? Because Congress banned them, citing the need to reduce “greenhouse gas emissions” to reduce global warming that isn’t happening.
It’s the same Congress that had already determined how much water your toilet can use to flush. It’s the same Congress that determined “cafe” rules that determine how many miles per gallon your automobile must achieve. It’s the same government that requires ethanol be added to gasoline, thus reducing the mileage a gallon of adulterated gasoline can produce, while also driving up the cost of gasoline as well as of corn, a food product, used to produce ethanol.
It’s the same Congress that has blessed a Renewable Electricity Standard that requires utilities to use electricity produced by wind and solar power even though both sources also require 24/7 backup by traditional coal-fired, natural gas, or nuclear plants because they cannot be relied upon to generate electricity in a predictable fashion or during periods of peak capacity.
It’s the same Congress that initiated Fannie Mae and Freddie Mac, two “government entities” that purchased the sub-prime mortgage loans that banks and mortgage loan firms were required to make to people who clearly could not afford to repay them. The result is the financial crisis that occurred when those “bundled” mortgages turned out to be “toxic”, worthless paper sold to investment firms and banks as assets.
In early September, The Washington Post, published an article, “Light bulb factory closes; End of era for U.S. means more jobs overseas.” It reported that “The last major General Electric factory making ordinary incandescent light bulbs in the United States is closing this month...the remaining 200 workers at the plant here (Winchester, Virginia) will lose their jobs.”
In June, The Washington Times reported that the Federal Trade Commission earlier this month (released) 91 pages of regulations that will force manufacturers to revise their packaging and make costly compact fluorescent bulbs appear more appealing to consumers,” that they have refused to willingly purchase them. “Congress wants to force the pale, cold fluorescent curlicue fixtures on everyone because it makes members feel that they are doing their part to ‘save the planet’.”
While the ban was initiated in 2007 before the Obama administration took power, it has not gone unnoticed that the CEO of General Electric, Jeffrey Immelt, “sits on Obamas Economic Recovery Advisory Board.” And recovery is no where in sight while GE closes its factory making incandescent light bulbs.
There’s more. GE was the recipient of bailout funds and, according to an article on FrontPagemag.com, “stands to benefit from current and future contracts with the U.S. government.” Connect the dots. GE owns MSNBC, a cable news channel famous for its adulation of Obama before and since his election.
The issue, however, is far less about GE than it is about the vast global warming fraud, the equally vast matrix of U.S. laws and regulations that is based on it, and most importantly, the way they are being used to undermine and destroy the U.S. economy along with the freedoms that Americans take for granted.
One of the many tasks facing a Congress in which Republicans are expected to regain control in November is to repeal the ban on incandescent light bulbs. After that, the mountain of other laws and regulations strangling consumer freedom and even threatening the health of Americans must also be repealed.
All nations must evolve, but America is moving toward less freedom of choice; more control over the choices that a free market requires. It is rejecting its founding principles and it is doing so based on environmental lies. See post here.
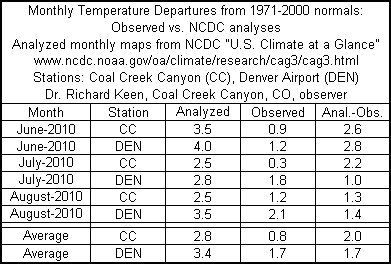
By Dr. Richard Keen
At the end of each month, NCDC posts a “U.S. Climate at a Glance” summary on its website. The post features a color map of monthly mean temperature anomalies (departure from normal) for the entire U.S., based on an unspecified selection of stations.
It’s fun to find your home and pick out what the previous month was like there. I’ve done that for the past two months (June and July), and compared the analyzed departures to those actually measured at my NWS co-op station at Coal Creek Canyon, Colorado. For both months I found that the map departures calculated by NCDC for my location were about two degrees higher than the directly measured departure. The reports were posted on ICECAP and Watt’s Up With That, and last month I closed by saying..."I’ll keep checking this in future months, but I suspect the story will remain the same, with mystery adjustments inflating the temperature departures in one direction only.”
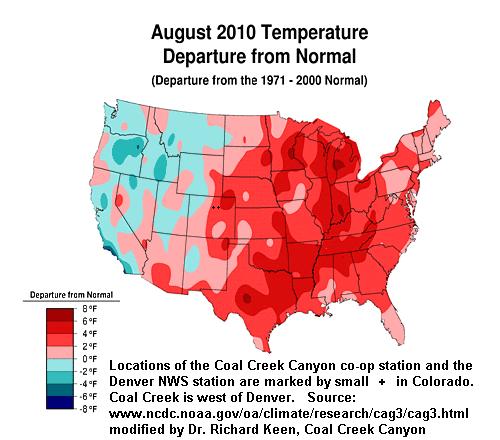
Now here is August’s report. I added the locations of Coal Creek Canyon and of the nearest NWS first-order station, Denver, to the map. On the map, both stations are within the +2F contour, with Denver approaching +4F. My best interpolation gives analyzed map departures of +2.5F at Coal Creek and +3.5F at Denver. Compare that to the actual departures (compared to the calculated normals for each station) of +1.2 and +2.1, respectively. Once again, the point departures in this part of Colorado are inflated by more than one degree.
Here is a list of the compared departures and Coal Creek and Denver for June, July, and August, 2010. The story is consistent - the NCDC analysis has the summer of 2010 running 3 degrees hotter than normal, while the observations have warm anomalies of less than half that. Those “mystery adjustments” raised Colorado’s summer temperature by 2 degrees above the direct measurements. Keep in mind that this two degree discrepancy is greater than the alleged “Climate Change” signal to date.
As I noted earlier, this is simply a spot check of two of NCDCs 2000 grid points. But Denver is a major first-order station, and Coal Creek has been a stable station with no moves or urban influences for almost 30 years, and the instruments are meticulously maintained. Coal Creek is at 8950 feet elevation in the Colorado Rockies, a region predicted by all models referenced by the IPCC to have the greatest warming in the “lower 48” United States. According to NCDC analyses, this warming is occurring. According to actual observations, it is not.

See enlarged here.

See enlarged here.
See PDF here.
------------------
Multidecadal Tendencies in ENSO and Global Temperatures Related to Multidecadal Oscillations
Energy & Environment, Volume 21, Numbers 5, pp. 437-460, September 2010, Joseph D’Aleo, Don Easterbrook
Abstract: Perlwitz etal (2009) used computer model suites to contend that the 2008 North American cooling was naturally induced as a result of the continent’s sensitivity to widespread cooling of the tropical (La Nina) and northeastern Pacific sea surface temperatures. But they concluded from their models that warming is likely to resume in coming years and that climate is unlikely to embark upon a prolonged period of cooling. We here show how their models fail to recognize the multidecadal behavior of sea surface temperatures in the Pacific Basin, which determines the frequency of El Ninos and La Ninas and suggests that the cooling will likely continue for several decades. We show how this will be reinforced with multidecadal shift in the Atlantic (and declining solar activity).
See publication here. More to come.
---------------
Radio/Internet Interviews
Brian Sussman, was this morning’s guest on the Tea Party Power Hour radio show. Brian discussed his new book Climategate: A Veteran Meteorologist Exposes The Global Warming Scam. Most intriguing was his discussion of how man-made global warming fits into the Marxist/Socialist/Communist agenda. To listen to the interview, please click on this link.
Steve Goreham, the author of Climatism: Science, Common Sense, and the 21st Century’s Hottest Topic, Recently joined us to discuss his new position as the head of the Climate Science Association of America. Goreham says his new association will try to take the politics out of climate science. To listen to the interview, please click on this link.
Is Cap and Trade dead in the United States? It may not matter as the Environmental Protection Agency prepares to regulate CO2 and other greenhouse gases as pollution. Shannon Goessling of the Southeastern Legal Foundation discusses her organization’s four lawsuits against the EPA here.
By Anthony Watts, Watts Up With That
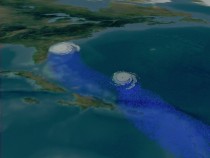
Two hurricanes approaching the coast of the United States, with the second hurricane slowed due to cooler waters caused by the track of the first
The Atlantic has been running warm lately, but that’s because there’s been little happening with Nature’s natural heat transporters. WUWT commenter SteveM pointed out something interesting in the latest SST image from NESDIS, but before we have a look at the animation I developed from that imagery, I thought we should have a look at the role that hurricanes play as heat engines.
First an animation from Goddard Space Flight Center:
And another, showing how the heat transport and surface cooling process operates.
From NASA SVS: As water vapor evaporates from the warm ocean surface, it is forced upward in the convective clouds that surround the eyewall and rainband regions of a storm. As the water vapor cools and condenses from a gas back to a liquid state, it releases latent heat. The release of latent heat warms the surrounding air, making it lighter and thus promoting more vigorous cloud development.
Now let’s watch this simple animation of the last two weeks of Sea Surface Temperatures and you’ll see the cool water tracks left by hurricanes Daniel and Earl:
click here to enlarge and animate
You can see the cool tracks in the last frame. Note also the large and growing La Nina off the west coast of South America. It’s turning deep purple and on to black. Way cool. See post here.
“The climate and renewable energy con is losing its luster - prompting anguish and desperation” Icecap Note: To see how desparate they have become - they are lying through their teeth as this SPPI story by Tom Nelson shows. This is what happens when prophecies fail.
By Paul Driessen
It’s been a rough few weeks for the “eco-progressive” fringe.
Static jet streams induced near-record high temperatures in parts of the United States and Russia, but extreme cold pummeled Seattle, England and much of the Southern Hemisphere. Perhaps Al Gore, Michael Mann and Rajendra Pachauri can turn this hodgepodge into “catastrophic climate change,” but most folks understand it as Mother Nature and weather.
Polls and news accounts find more Americans, Europeans and other people becoming weary and skeptical of “manmade global warming disaster” claims, convinced that natural forces are the primary cause of recurrent climate change, and unwilling to accept soaring energy prices and reduced living standards in the name of stabilizing Earth’s unpredictable climate.
Few Americans place any value on EPA Administrator Lisa Jackson’s meaningless statement - that “climate change is happening and humans are contributing to it” - to justify the draconian regimes the agency is trying to impose. The issue is whether our emissions of plant-fertilizing carbon dioxide is causing catastrophic climate change, and there is no credible evidence of that.
The House-passed energy and climate bill remains moribund in the Senate. EPA is trying to regulate carbon dioxide in the absence of congressional action based on its assertion that automotive, power plant and factory CO2 emissions “endanger human health and welfare.” However, Texas refuses to knuckle- under, other states may likewise balk, and the next Congress could overturn the “endangerment” finding and bar EPA from rewriting the Clean Air Act and implementing its job-killing rules.
“Avatar” director James Cameron double-dared global warming disaster skeptics to debate him - then morphed into a chicken and cackled off when they accepted his increasingly ludicrous debate terms, calling his critics “swine” as he headed for the hills.
Having read too many Gore, Pachauri, Quinn and other Deep Ecology treatises, LunaBomber James Lee held Discovery Channel employees hostage and denounced the TV station for its support of “parasitic human infants,” before being shot by police. His website and actions underscore how demented some Earth Liberation and global warming fanatics have become.
As their economies have deteriorated, Germany, Italy, Spain and other countries have pulled the plug on unsustainable wind and solar subsidies, eliminating thousands of “green” jobs and putting hundreds of “clean energy” companies on the verge of bankruptcy.
Glen Beck’s “Restoring Honor” rally on the National Mall drew 300,000 people. Meanwhile, “CarnivOil” events in Wisconsin drew more yawns than people, as desperate Big Environment groups struggled to regain their momentum, by ranting about global warming, the Gulf oil spill, and “evil” oil companies.
Americans increasingly understand that even sending US carbon dioxide emissions back to 1870 levels, as congressional climate bills would do, will not reduce global atmospheric CO2 levels, because emissions from China, India and other nations will rapidly offset our painful reductions. Those countries have made it clear that they will not sacrifice improved living standards for assertions that we can stabilize global temperatures by keeping atmospheric CO2 levels below 0.035-0.045% (350-450 ppm).
As China’s former representative for climate negotiations recently said: “Developing nations...are not willing to combat climate change if the price is continued poverty.” The Chinese government has made “no concessions on the country’s right to develop.” Many problems can be solved only through development. “There are 600 million people in India without electricity. The country has to develop and meet that need. And if that increases emissions, I say, So what? The people have a right to a better life.”
Harvard University investigated and sanctioned Professor Marc Hauser for grossly exaggerating his primate research results. Yet, his actions pale by comparison to what Phil Jones, Michael Mann and other Climategate researchers engaged in. Hauser’s grants were a drop in the bucket compared to the climate cabal’s. And he was not advocating massive, expensive, punitive changes in our lives, liberties, and energy and economic systems. Will other institutions match Harvard’s demand for integrity?
The independent InterAcademy Council investigated the UN’s Intergovernmental Panel on Climate Change and issued a tough report that may help bring some integrity, transparency, accountability and sanity to what thus far has been mostly politics and activism masquerading as science. The IPCC, says the IAC, needs to replace data manipulation, suppression and bias with honest science; end conflicts of interest; incorporate contrary data and opinions; and back up headline-grabbing disaster claims with actual evidence (not just computer modesls or World Wildlife Fund press releases).
In other words, it must stop trying to prove manmade carbon dioxide is the sole or primary factor in climate change - and seek evidence-based answers to what drives climate change, what we might expect in the future, and how humans can better adapt to warmer, colder, wetter or drier futures.
The IAC and Hauser precedents should serve as a warning to climate colluders and manipulators. They are also increasing pressure on IPCC Chairman Pachauri to abdicate his throne, and be replaced by a respected climate expert who can bring a degree of integrity to this politicized organization.
HOWEVER, a belligerent Pachauri has told the Times of India he has “shed any inhibitions or feelings of cowardice. I believe this is now my opportunity to go out and do what I think is right. In the second term I may be a little more uncomfortable for people than I was in the first.”
Senator Harry Reid says he may still try to pass even a minimalist renewable energy bill in the Senate, and then use it to ram through an economy-disrupting climate bill during a lame duck session, if even by a single vote. That would make the United States the only country to enact draconian climate and energy rules in the midst of a recession - sending millions of jobs overseas, where energy prices and regulatory regimes are more hospitable and governments believe people have a right to better lives.
Aided by George Soros, leftist foundations and our own tax dollars (via EPA and other government agencies), radical greens are spending millions to lobby Congress. The Washington Post is giving free media to what it calls “some of the country’s most respected environmental groups” - helping them spin absurd street theater like CarnivOil into “educational” programs about saving Planet Earth (with vile oil executives bribing boxing referees and knocking out crab-costumed activists).
Teamster, teacher, auto and service employee unions are paying their own employees minimal wages and benefits, and sacking them for trying to unionize, columnist Deroy Murdock chronicles - while preparing to pump $50 million and legions of campaigners into ruling class Democrat reelection campaigns.
Meanwhile, Congress and EPA are pouring tens of millions of taxpayer dollars into Regional Greenhouse Gas Initiatives, to help RGGI director Jonathan Schrag persuade states to implement increasingly restrictive fossil fuel, emission and renewable energy mandates, regardless of what Congress does - and pay for his new $2.2-million loft in Manhattan.
The price of liberty is eternal vigilance. Today, on energy security issues, we unfortunately have less to worry about from external enemies, than from our own elitist politicians, bureaucrats and pressure groups.
In this critical election season, let us hope enough voters step up to defend our liberties, jobs, civil rights and children’s future. PDF
Paul Driessen is senior policy advisor for the Committee For A Constructive Tomorrow and Congress of Racial Equality, and author of Eco-Imperialism: Green power - Black death.
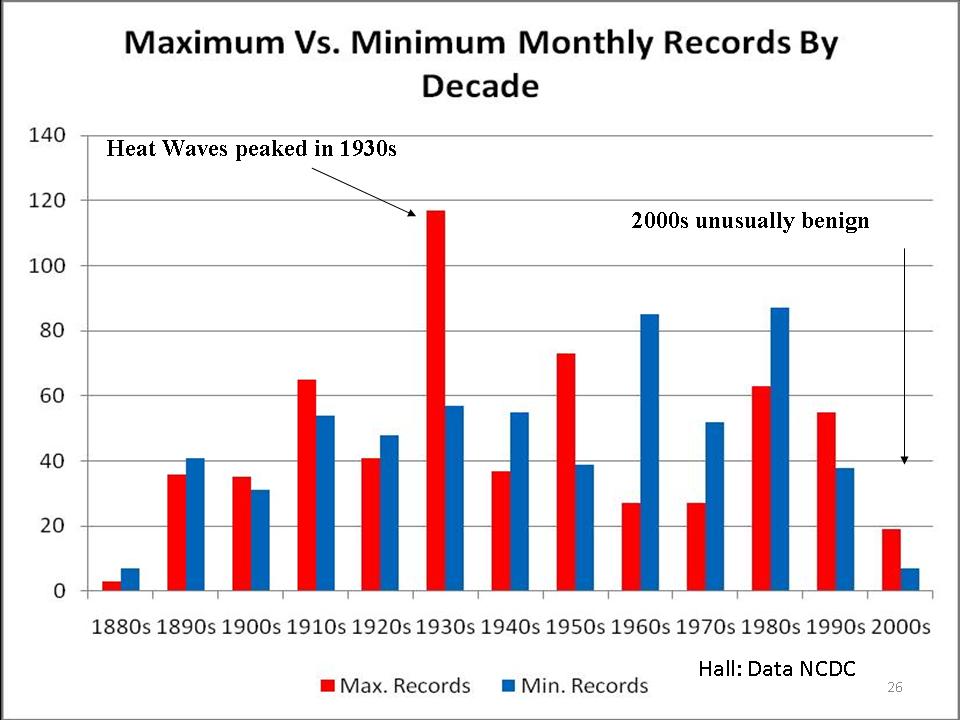
Are Heat Records Due To CO2? Ooops, No New Hot Record Temps In Last 30+ YearsNote: The CATO Institute is sponsoring the Green Swindle here. Well worth your time.
C3
Since the late 1980’s, global warming alarmists have been blaring ad nauseum that the world is suffering from ever higher temperatures, setting new hot temperature records, supposedly on a constant basis. Whenever warm weather arrives in the Northern Hemisphere, the warming hype onslaught from government paid climate scientists, MSM journalists and Hollywood celebrities escalates, as seemingly every new day, new week, new month, new quarter, new year and etc. is pronounced as the warmest evaaar! But is the world truly experiencing these highly publicized extreme, unprecedented hot temperatures?
The simple and honest answer is an emphatic ‘NO!’. In a previous post, the actual temperature data from weather stations around the world showed that “global” warming is actually regional warming, and, my goodness, also regional cooling. And if human CO2 emissions were really causing unprecedented, hot global weather (temperatures) then new hot temperature records for each continent should be happening - it ain’t happening, though, folks.
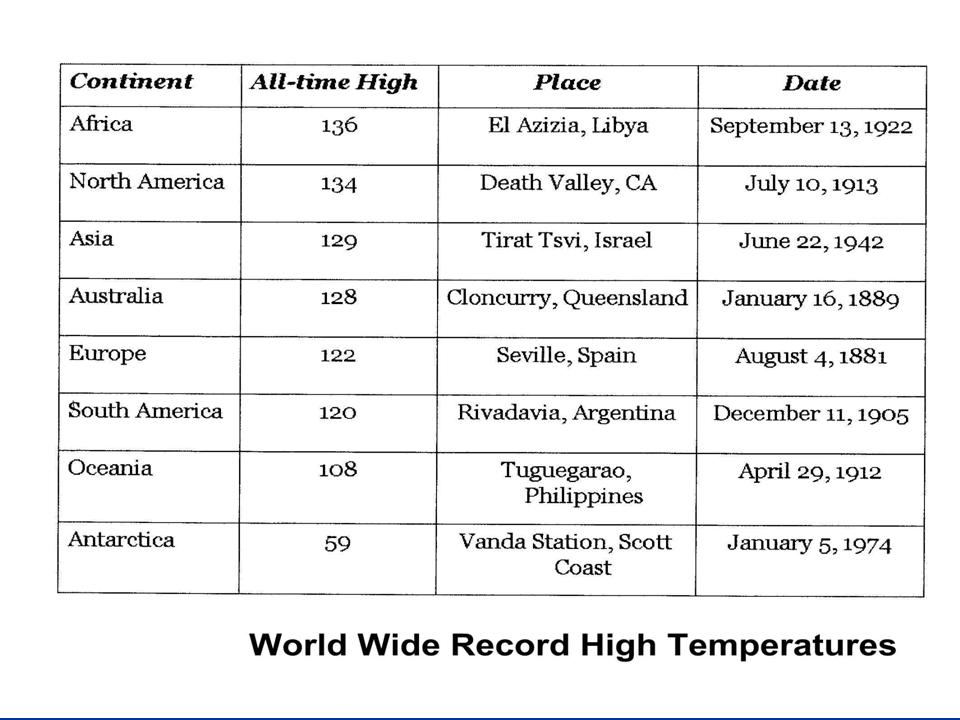
Looking at the map below (map source enlarged), the hottest and coldest temperatures ever recorded in modern times are presented for each continent.
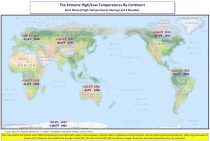
Look closely and realize what has actually not taken place. The last ‘hottest’ temperature record was set way back in 1977. Per the calendar, some 33 years later, no continent has exceeded their previous hot temperature record - and some of those records go all the way back to the early 20th century.
Hey...the next time you hear or read “unprecedented temperatures” from a ignorant leftist/liberal elite, don’t cut them any slack, go ahead and snicker (or start giggling) - it’s alright, you’re allowed to laugh at the stupendous ignorance exhibited by the Gore-zombies of the “progressive” left.
Remember, the myth that Earth “has a fever,” and the myth that human CO2 causes extreme temperatures, and the myth that unprecedented warming is global, are just that: myths, spread by individuals with a variety of crazy-leftist agendas.
For map (click here to enlarge). See table form below (source NOAA NCDC).
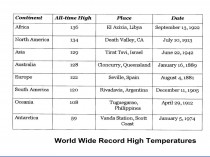
Enlarged here.
Did we say “extreme?” A few more Wikipedia extreme temperature/weather trivia points of relevance: (1) Fastest temperature rise recorded - 49F in 2 minutes in 1942; (2) Fastest temperature drop recorded - 47F in 15 minutes in 1911; (3) Most consecutive days above 100F recorded - 160 days from 1923 to 1924. And by the way, each of these most extreme weather events took place well before the influence of large human CO2 emissions.
Additional current temp charts here. Historical temp charts here. Excellent compilations!
See US state heat records (50 states - 12 months) below enlarged here (source Bruce Hall compiled from NCDC)

----------------------
CRU, NOAA AND NASA DATA MANIPULATION
By Joseph D’Aleo, CCM
Phil Jones admitted to the BBC that there was no statistically significant warming since 1995 and that it had cooled globally 0.12C from 2002 to 2009, not statistically significant but nonetheless a cooling even asw CO2 continued to rise. Temperatures popped this year as a strong though relatively brief El Nino came on. Even with El Nino, it was a brutally and in places all-time record cold winter in many land areas of the Northern Hemisphere last winter, but the Pacific thanks to the warm El Nino and the Atlantic thanks to a lack of tropical activity the prior summer and less wind and clouds with a weakened and suppressed subtropical high and high latitude blocking high pressure were both unseasonably warm. Land areas felt some of that warmth this summer though La Nina cooled the Pacific dramatically.
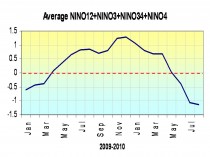
Average NINO region temperatures since January 2009 (enlarged here).
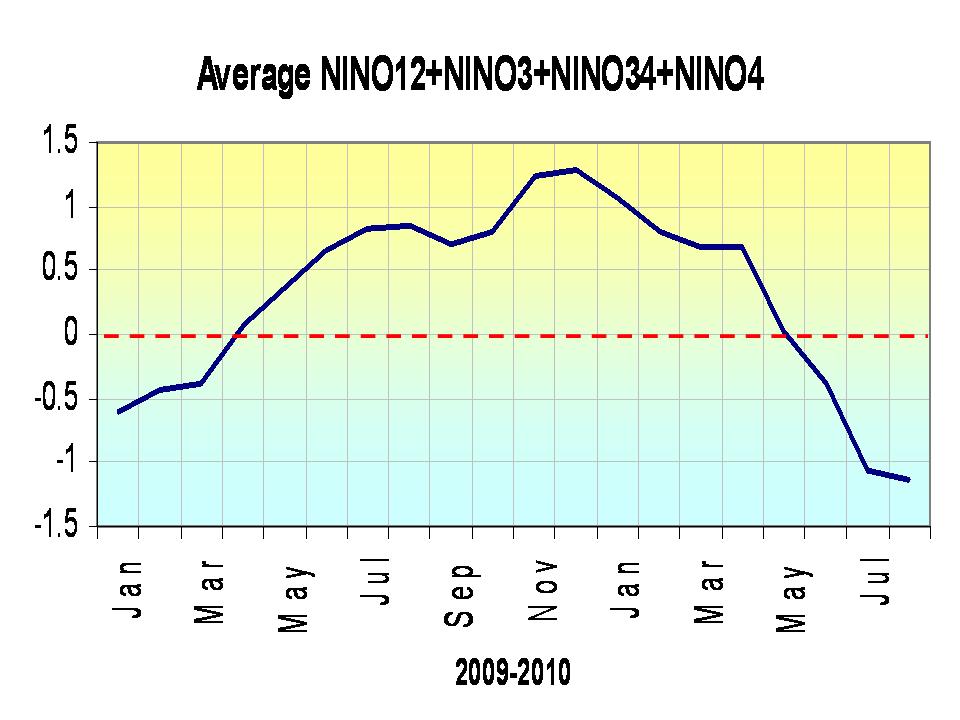
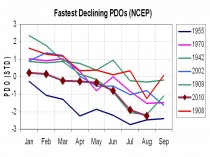
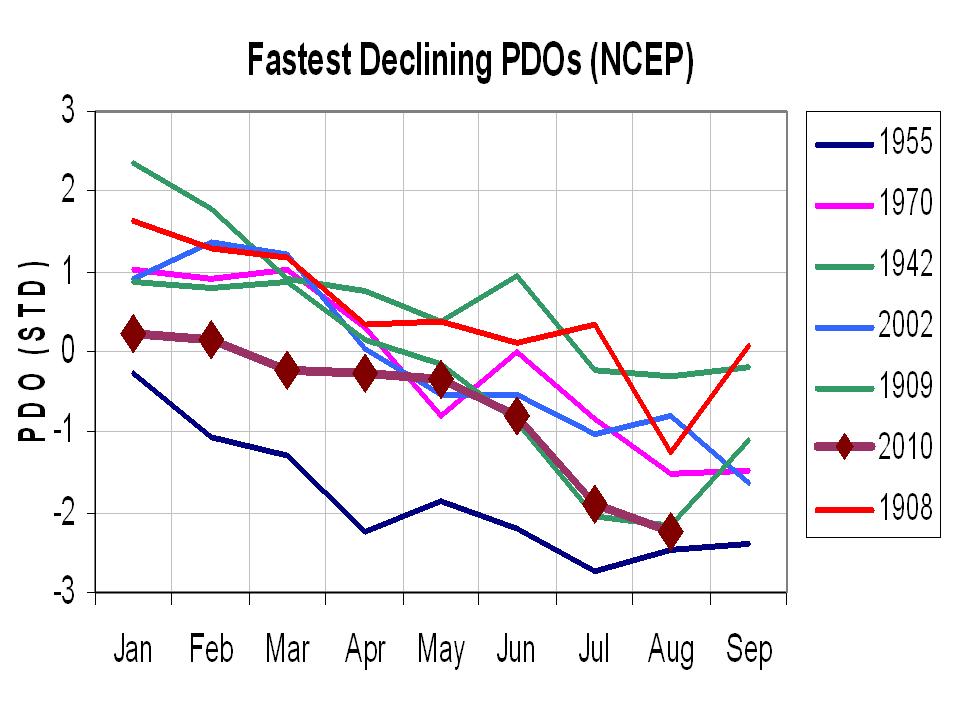
The PDO was slightly positive with the strong El Nino this January but is now strongly negative. This is a plot of all years in which the Multivariate ENSO Index (MEI) declined more than 2 STD from January to August. Enlarged here. This should induce a global cooling in upcoming months. This will be aided by a cooling of the Atlantic by the tropical activity which is enhanced by La Nina and acts to extract excess tropical heat from the tropical oceans and reduce warm anomalies further north through mixing.
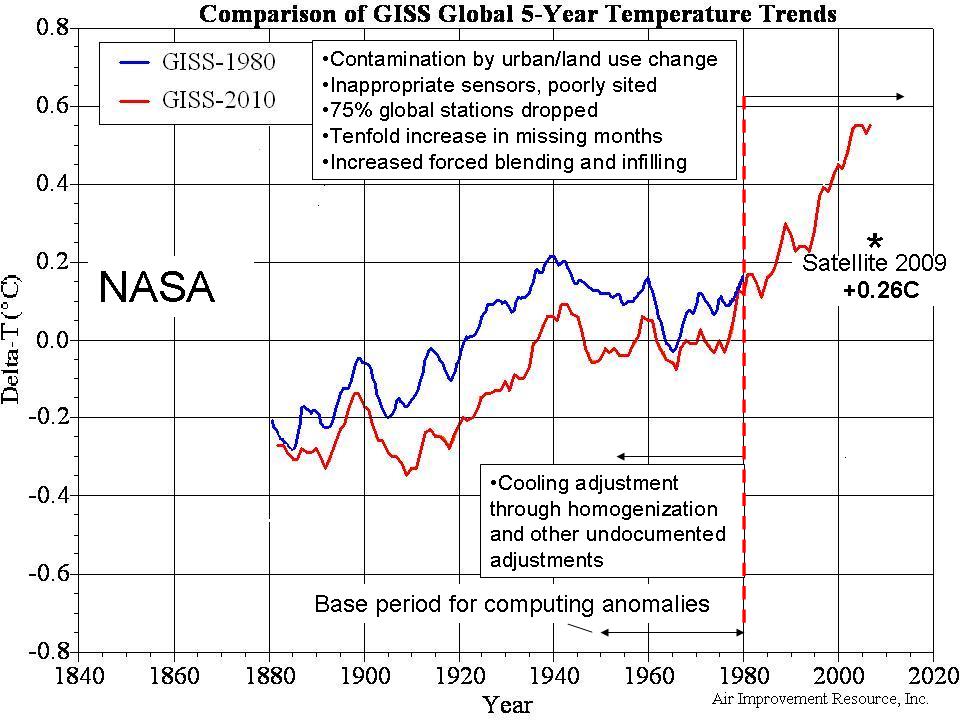
Nevertheless the manipulation of the global data bases in all the data sets over the last century has elevated the chances that each month will rank among the warmest. All three data centers have cooled the past and warmed the more recent years through their data manipulation. Here are NASA plots of 1980 and 2010.
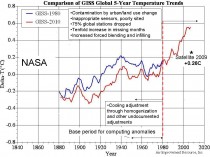
Enlarged here.
Here is the CRU plot just since 2001.
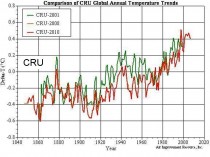
Enlarged here.
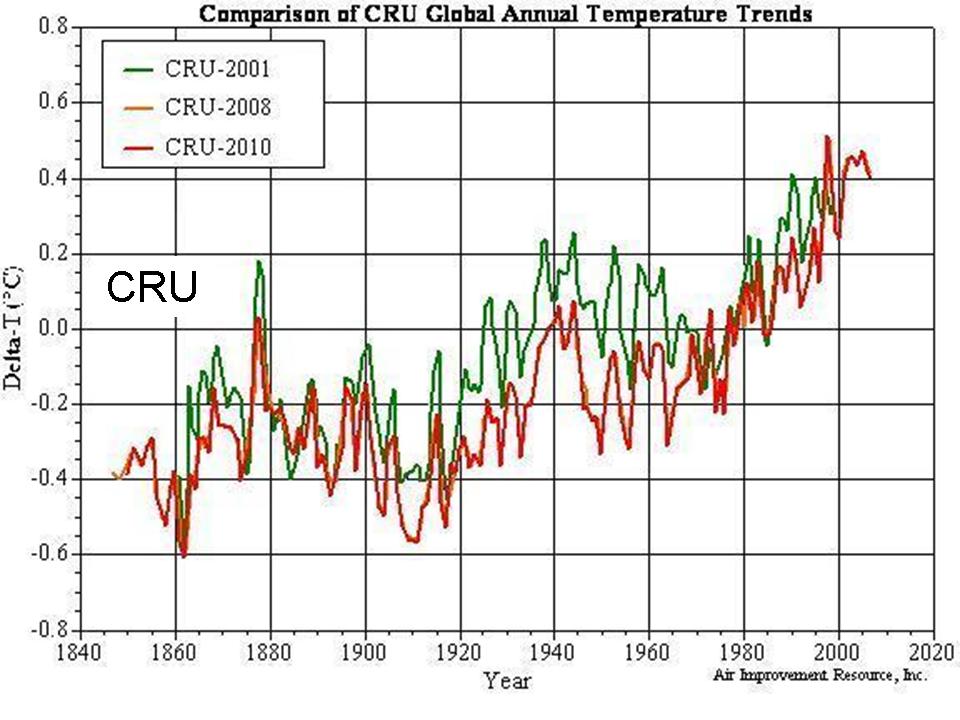
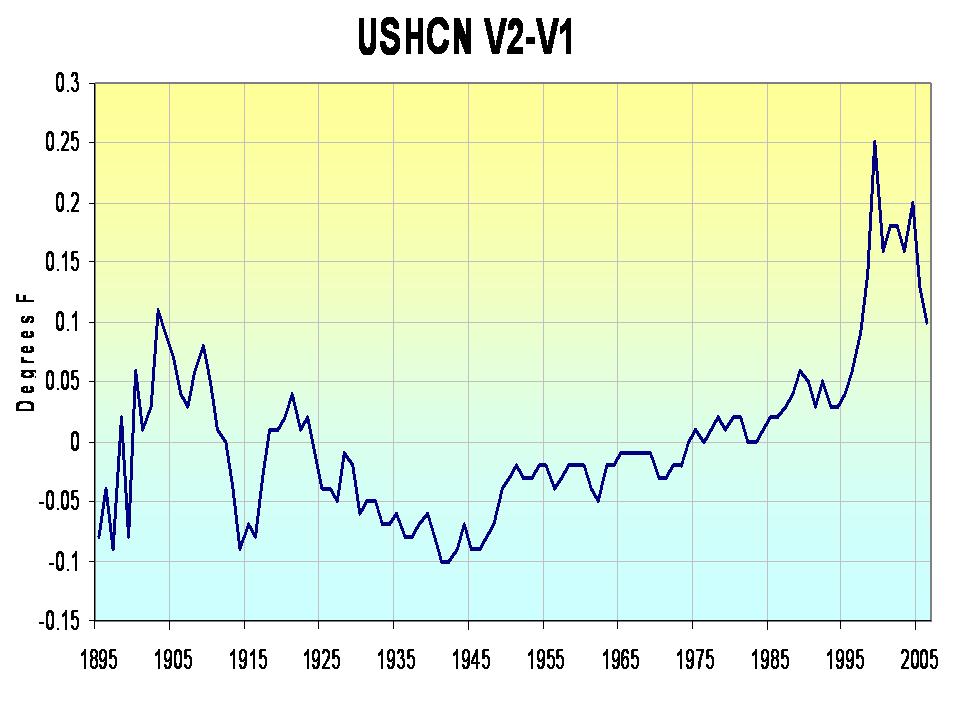
This is the change in the NOAA USHCN in 2007 from the original version in 1990.
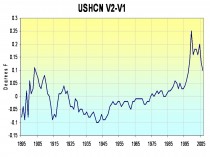
Enlarged here. More on NOAA coming soon.
All three data centers have cooled the past and allowed data issues produce increasingly warm biases in the last few decades to ensure the data is more in line with their models (but even with the changes, it is falling far short). They have succeeded in ensuring they can claim ranking warm months and years but can’t yet match their models.
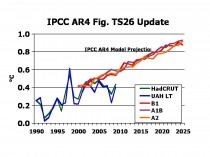
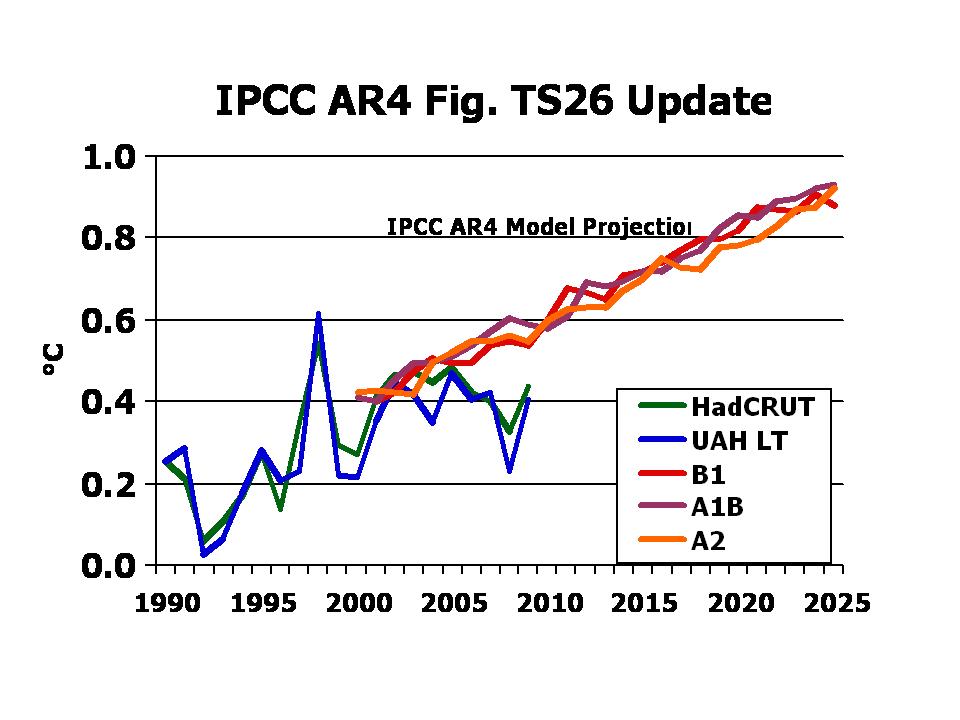
Enlarged here. Source John Christy UAH annual vs IPCC AR4 projected scenarios for temperatures.
Wait until the ocean cooling and long solar cycle 23 and wimpy cycle 24 evolves. See story here.
By Dr. Tim Ball, Canada Free Press
It’s time to stop the lies, deceptions, denials and fantasy that is the world of political climate science known as the Intergovernmental Panel on Climate Change (IPCC). Official climate science recently offered more insults, comparable to the whitewash investigations of Michael Mann, and the Climatic Research Unit (CRU) gang, with its latest ‘investigation’ of the IPCC.
They think a simple mea culpa will do the job and allow them to continue their corrupt and corrupting ways. It won’t and it can’t. Not even the full mea maxima culpa will solve the problem.
The most recent whitewash
The most recent whitewash began with UN Secretary General Ban ki Moon ordering a supposedly independent investigation. The Inter Academy Council (IAC), which combines 15 Science Academies, whatever that means, were assigned to produce a very limited report. “The review by the IAC will not involve any in-depth analysis of the report produced by the IPCC, or of any “vast amounts of data”. “
It’s no surprise they prepared a very shallow report that identifies some errors and makes recommendations for the ongoing IPCC, but it is grossly inadequate. Why didnt they talk to people who have raised questions about the process? Why didnt they review the extensive literature on problems with the IPCC and the entire process? Why didn’t they recommend the removal from office of Rajendra Pachauri, Chairman of the IPCC? His activities are well documented and clearly show his integrity is completely compromised. The scientist whose false report on retreat of Himalayan glaciers was used by the IPCC worked for TERI of which Pachauri is the chairman. Why do they avoid the connections between CRU and IPCC?
The answer is given in the list of members of the IAC Board. It includes Ralph Cicerone, which though he may not have been involved in the Report, gives a flavor of the bias of the group. He has been very active in defense of the IPCC positions and in attacking those who dare question. Here is what he said about IPCC reports, “This is the most comprehensive report ever on climate change,” said atmospheric scientist Ralph J. Cicerone, the president of the academy. They outline “why the U.S. should act now to reduce greenhouse gas emissions and why we should have a national strategy to adapt to the inevitable.”
It is underlined by the fact the last IAC report was on alternate energy, the unworkable but favorite solution of IPCC proponents.
Inter Academy Council demonstrate their lack of understanding
The IAC clearly has no idea of the history of the political hijacking of climate science that used the UN, the WMO and culminated in the IPCC. They acknowledge some of the minor errors made, such as the article on Himalayas glaciers that they used to claim ice was melting and faster than any logical research allowed. They dismiss these items as misguided and fail to put them in the entire context of corruption that is the IPCC. They fail to make the connection between the leaked emails from the Climatic Research Unit (CRU) people and the IPCC. They demonstrate their lack of understanding by advising the IPCC not to make predictions unless they had solid evidence. The United Nations climate panel should make predictions only when it has solid evidence and should avoid policy advocacy, scientists said in a report yesterday that called for thorough reform of the body.
The problem is the IPCC doesn’t make predictions. They stopped after their dismal failures in the first two Reports. They cleverly and deliberately called them projections from a range of scenarios. Of course, the mainstream media choose to report the worse case scenario with regard to temperature increase. All these scenarios are based on false assumptions and evidence that was given far too much credence. As Chairman of the IAC group, Princeton professor Harold Shapiro said one of the Reports, “contains many statements that were assigned high confidence but for which there is little evidence.”
It wasn’t just one of the Reports. Shapiro, and likely his group, fails to understand each Report builds on the previous one purportedly adding new material. In fact, the record shows they eliminated awkward material such as the graph showing the Mediaeval Warm Period (MWP), or ignored well-documented research such as the Svensmark theory on the relationship between sunspots and global temperature.
After the IAC Report was released, Ban Ki Moon confirmed the incestuous nature of the investigation and gave an example of the gamesmanship he practices so well. He and Achem Steiner, head of the United Nations Environmental Program (UNEP), said the report had done nothing to undermine the solid science in the IPCC Report. Of course not, they deliberately worked to that goal.
Nothing will change soon. Too many political, bureaucratic and academic careers are dependent on perpetuating the IPCC. Too many green industries have developed to take advantage of the billions governments have poured into alternate energies and other unworkable projects. Too many lobby groups are dependent on government funding, and use the IPCC message to shake funds out of a deceived and worried public.
In a recent article I recommended scrapping government weather agencies.
Maurice Strong used the UN to set up the IPCC and pursue his political goals
This is important because it was through them and their membership in the World Meteorological Organization (WMO) that IPCC was created, funded and perverted. Maurice Strong used the UN to set up the IPCC and pursue his political goals. Its entire purpose was political and not scientific at all. The IAC were chosen not to realize this and couldn’t know because they didn’t do their research. To their credit they acknowledge the political leanings when they report that the IPCC is “at the interface between science and politics”, but it appears more a comment to quiet complaints than expose the obvious. They say the political actions of some senior IPCC members are harmful. “Straying into advocacy can only hurt IPCCs credibility”. The reality is it has none and should be disbanded immediately along with the government weather agencies used for its creation.
Tim Ball interviews on Climategate here and here. CFP post is here.
Dr. Tim Ball is a renowned environmental consultant and former climatology professor at the University of Winnipeg
By Ray Lilley, AP
WELLINGTON, New Zealand (AP) - A powerful 7.1-magnitude earthquake struck much of New Zealand’s South Island early Saturday and caused widespread damage, but there were just two reports of serious injuries. Looters broke into some damaged shops in Christchurch, police said.
The quake, which hit 19 miles (30 kilometers) west of the southern city of Christchurch according to the state geological agency GNS Science, shook a wide area, with some residents saying buildings had collapsed and power was severed. No tsunami alert was issued.
GNS Science initially reported the quake as magnitude 7.4, but later downgraded it after re-examining quake records. The U.S. Geological Survey, in America, measured the quake at 7.0.
Christchurch Mayor Bob Parker declared a state of emergency four hours after the quake rocked the region, warning people that continuing aftershocks could cause masonry to fall from damaged buildings.
The emergency meant parts of the city would be closed off and some buildings closed as unsafe, he said. Minister of Civil Defense John Carter said a state of civil emergency was declared as the quake was “a significant disaster,” and army troops were on standby to assist.
Parker said the “sharp, vicious earthquake has caused significant damage in parts of the city ... with walls collapsed that have fallen into the streets.” Chimneys and walls had fallen from older buildings, with roads blocked, traffic lights out and power, gas and water supplies disrupted, he said.
“The fronts of at least five buildings in the central city have collapsed and rubble is strewn across many roads,” Christchurch resident Angela Morgan told The Associated Press. “Roads have subsided where water mains have broken and a lot of people evacuated in panic from seaside areas for fear of a tsunami,” she said, adding that “there is quite significant damage, really, with reports that some people were trapped in damaged houses.”
Christchurch fire service spokesman Mike Bowden said a number of people had been trapped in buildings by fallen chimneys and blocked entrances, but there were no reports of people pinned under rubble. Rescue teams were out checking premises.
Christchurch Hospital said it had treated two men with serious injuries and a number of people with minor injuries. One man was hit by a falling chimney and was in serious condition in intensive care, while a second was badly cut by glass, hospital spokeswoman Michele Hider said.
Christchurch police reported road damage in parts of the city of 400,000 people, with a series of sharp aftershocks rocking the area. Police officers cordoned off some streets where rubble was strewn about. Video showed parked cars crushed by heaps of fallen bricks, and buckled roads.
“There is considerable damage in the central city and we’ve also had reports of looting, just shop windows broken and easy picking of displays,” Police Inspector Mike Coleman told New Zealand’s National Radio. Police Inspector Alf Stewart told the radio that some people had been arrested for looting. “We have some reports of people smashing (storefront) windows and trying to grab some property that is not theirs ... we’ve got police on the streets and we’re dealing with that,” he said.
Suburban dweller Mark O’Connell said his house was full of smashed glass, food tossed from shelves, with sets of drawers, TVs and computers tipped over.
“She was a beauty, we were thrown from wall to wall as we tried to escape down the stairs to get to safety,” he told the AP. “It was pitch black (with the power cut) and we walked through smashed glass everywhere on the floor.”
The quake hit at 4:35 a.m. (1635 GMT) shaking thousands of residents awake, New Zealand’s National Radio reported. Some 12 aftershocks have rocked the region since, ranging from 5.3 to 3.9 in magnitude, GNS Science reported on its web site.
Prime Minister John Key, Carter and Energy Minister Gerry Brownlee were to fly to Christchurch to inspect damage and review the situation, officials said.
Civil defense agency spokesman David Millar said at least six bridges in the region had been badly damaged, while the historic Empire hotel in the port town of Lyttelton was “very unstable” and in danger of collapse. Roads, shops and other buildings in rural towns around Christchurch had also suffered damage, with some shop fronts knocked down in the jolt.
Inspector Coleman said residents of the city’s low-lying eastern suburbs had been advised to be ready to evacuate their properties, after power, gas, sewerage and water systems were cut by the quake. Resident Colleen Simpson said panicked residents ran into the street in their pajamas. Some buildings had collapsed, there was no power, and the mobile telephone network had failed.
“Oh my God. There is a row of shops completely demolished right in front of me,” Simpson told the Stuff news Web site.
Kiwirail rail transport group spokesman Kevin Ramshaw said 13 mostly freight trains had been halted on South Island lines, with some damage already confirmed to rail lines north of Christchurch.
Christchurch International Airport was closed after the quake as a precaution, as experts checked runways and terminal buildings, a spokesman said.
The Pacific Tsunami Warning Center said “no destructive widespread tsunami threat existed, based on historical earthquake and tsunami data.” New Zealand sits above an area of the Earth’s crust where two tectonic plates collide. The country records more than 14,000 earthquakes a year - but only about 150 are felt by residents. Fewer than 10 a year do any damage.
New Zealand’s last major earthquake was a magnitude 7.8 in South Island’s Fiordland region on July 16, 2009 - a tremblor which moved the southern tip of the country 12 inches (30 centimeters) closer to Australia, seismologist Ken Gledhill said at the time. Gledhill, director of GNS Science’s “GeoNet” national earthquake monitoring project, said the island’s geographic shift showed the immensity of the forces involved. Read more and see videos here.

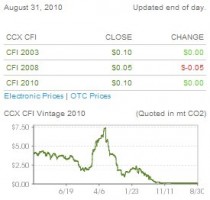
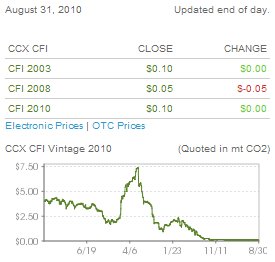
The only lower price than today’s closing price on a ton of carbon is ZERO.
Perhaps reacting to the news yesterday about the IPCC getting taken to the woodshed, the growing number of stories in the MSM about the IPCC failure, and the recent layoffs at CCX, carbon trading has once again been devalued by the market. Amazingly, it lost 50% of it’s value for 2006, 2007, and 2008 “carbon instruments” today. Here’s the CCX front page graph at closing today:
Enlarged here.
The CCX end of day table really says it all, 50% off, from a dime to a nickel in a day:

CCX end of day, August 31, 2010
It must have really killed the person to have to put in a nickel for the closing value today.
Charcoal briquettes and coal have more value than a ton of CCX carbon instruments these days.
Unless CCX starts making adjustments in single cents, the next downward adjustment is zero. The latest CCX advisory says they will be closed for labor day, and will reopen for trading September 7th. One wonders. See post here.
See Alan Caruba’s Carbon Dioxide Riches Disappear here.
------------
Retro back to early last year for this story in the Canada Free Press:
Obama’s involvement in Chicago Climate Exchange -the rest of the story
By Judi McLeod Wednesday, March 25, 2009
Good news to know that the truth will always out - even when you’re Barack Obama.
“Obama Years Ago Helped Fund Carbon Program He Is Now Pushing Through Congress’ is a FOXNews story by Ed Barnes. In short, ‘While on the board of a Chicago-based charity, Barack Obama helped fund a carbon trading exchange that will likely play a critical role in the cap-and-trade carbon reduction program he is now trying to push through Congress as president.”
The charity was the Joyce Foundation on whose board of directors Obama served and which gave nearly $1.1 million in two separate grants that were “instrumental in developing and launching the privately-owned Chicago Climate Exchange, which now calls itself “North Americas only cap and trade system for all six greenhouse gases, with global affiliates and projects worldwide.”
And that’s only the beginning of this tawdry tale, Mr. Barnes.
The “privately-owned” Chicago Climate Exchange is heavily influenced by Obama cohorts Al Gore and Maurice Strong. For years now Strong and Gore have been cashing in on that lucrative cottage industry known as man-made global warming. Strong is on the board of directors of the Chicago Climate Exchange, Wikipedia-described as “the world’s first and North Americas only legally binding greenhouse gas emission registry reduction system for emission sources and offset projects in North America and Brazil.”
Gore, self-proclaimed Patron Saint of the Environment, buys his carbon off-sets from himself - the Generation Investment Management LLP, “an independent, private, owner-managed partnership established in 2004 with offices in London and Washington, D.C., of which he is both chairman and founding partner. The Generation Investment Management business has considerable influence over the major carbon credit trading firms that currently exist, including the Chicago Climate Exchange.
Strong, the silent partner, is a man whose name often draws a blank on the Washington cocktail circuit. Even though a former Secretary General of the 1992 United Nations Conference on Environment and Development (the much hyped Rio Earth Summit) and Under-Secretary General of the United Nations in the days of an Oil-for-Food beleaguered Kofi Annan, the Canadian born Strong is little known in the United States. That’s because he spends most of his time in China where he he has been working to make the communist country the worlds next superpower. The nondescript Strong, nonetheless is the big cheese in the underworld of climate change and is one of the main architects of the failing Kyoto Protocol.
If we follow the time line on where Obama was during the funding of the Chicago Climate Exchange, he was still a lecturer at the University of Chicago Law School teaching constitutional law, with his law license becoming inactive a year later in 2002. It may be interesting to note that the Chicago Climate Exchange in spite of its hype, is a veritable rat’s nest of cronyism. The largest shareholder in the Exchange is Goldman Sachs. Chicago Mayor Richard M. Daley is its honorary chairman, The Joyce Foundation, which funded the Exchange also funded money for John Ayers’ Chicago School Initiatives. John is the brother of William Ayers.
The same Chicago Climate Exchange promoting public rip-off was funded by Obama before he was POTUS. Even as man-made global warming is being exposed as a money-generating hoax, Obama is working feverishly to push the controversial cap-and-trade carbon reduction scheme through Congress.
Obama was never the character he created for himself in the fairy-tale version in “Dreams of My Father”. He’s the agent of Change and Hope for cohorts making money down at the Chicago Climate Exchange. The Barbarians are pushing at the gate of the Global Warming fraud, and to borrow a line from children playing Hide and Seek, Here they come, ready or not! See post here. See list of CCX corporate members here.
Board members have included Maurice Strong, Mayor Richard Daley, Valerie Jarrett, Ed Begley Jr..
Posted by Kooten
Recently, Canada’s Global National News (Friday, July 16, 2010) carried a story indicating that 2010 was the hottest year on record. A follow-up article in Victoria’s Times-Colonist newspaper (July 18, 2010, p.A12) made a similar claim. The claims remind me of the children’s story “The Emperor has no Clothes,” about a tailor who managed to convince the emperor and his entourage that they were incapable of seeing the wonderful tunic he was sewing. When the emperor paraded in his new suit, a child exposed the scam by asking why the emperor had no clothes on.
Thus it is with climate. Although Victorians experienced a mild winter and spring, the last few months have been colder than usual. The Canadian prairies experienced a miserable winter and things were not much better elsewhere in North America and Europe. However, a few weeks of warm weather in Europe and eastern Canada, and it becomes easy to sell the idea that temperatures are the highest they have ever been and that 2010 is on course for become the warmest year ever! Is this so?
NASA temperature data underlie these stories. Consider the ten warmest years as reported in Table 1. The data in the table are here , but viewed on three different dates as indicated. Since data collected in August 2007 are available only through 2006, 2007 is not included in the earliest ranking given in Table 1.
Table 1: Ten Warmest Years based on Average Contiguous 48 U.S. Surface Air Temperature Anomalies, 1880 through 2006
Date when data was retrieved from NASA website
8/20/2007 5/27/2009 4/26/2010
1934 1934 1998
1998 1998 2006
1921 1921 1934
2006 2006 1921
1931 1931 1999
1999 1999 1931
1953 1953 1990
1990 1990 2001
1938 1938 2005
1939 1954 2007
NASA scientists have adjusted the data in ways that make more recent years appear warmer - scientists have dropped weather stations and/or used a different method for ‘adjusting’ the data. Thus, the number of years from the past two decades that appear in the top twenty warm years (only the top ten are shown in Table 1) has increased from 7 to 8 and finally to 11. In the May 2009 listing, 2007 is the 14th warmest year in the historical record, but it has moved up to tenth by the April 2010 listing. While it may be true that the latest adjustments are scientifically better than earlier adjustments, it seems odd that the most recent years now show up as among the warmest in the temperature record, contrary to evidence from satellite data and reconstructions by the Climate Research Unit at East Anglia University in the UK - reconstructions that use the same underlying data as NASA.
Other evidence fails to support the NASA story. Using the unadjusted U.S. weather station data, 22 out of 50 states recorded their highest temperature during the 1930s. Likewise, a 2006 study in the Journal of Geophysical Research found that 1941 was the warmest year experienced in Greenland between 1784 and 2005, while the 1930s and 1940s were the warmest decades; 1863 was the coldest year while the coldest decade was the 1810s (although it corresponded to two volcanic eruptions in 1809 and 1815). A 2010 study in Climatic Change reconstructs winter and spring temperatures for Stockholm going back 500 years. The warmest and coldest years are reported in Table 2. Notice that 1863 was the warmest winter/spring, while 1569 was the coldest.
Table 2: Ten coldest/warmest January-April Seasons in the Past 500 Years, Stockholm, Sweden, Temperature Anomalies in oC from 1961-90 Average
Rank Year Rank Year
Ten coldest Ten warmest
1 1569 1 1863
2 1573 2 1990
3 1557 3 1743
4 1595 4 1525
5 1572 5 1989
6 1942 6 1605
7 1614 7 1822
8 1600 8 1790
9 1574 9 1762
10 1940 10 2008
ICECAP NOTE: See (below, enlarged here) how NASA temperatures have been significantly manipulated since 1980. The changes produced a cooling of the warm blip in the 1930s and 1940s and a warming post 1980 for numerous reasons.
By Jeremy A. Kaplan
Acknowledging flaws in its reports and growing public skepticism toward the theory of manmade global warming, the United Nations hired an independent review panel in March to audit its climate-science arm. The group found plenty of problems.
The InterAcademy Council, an independent group of scientists representing agencies from around the world, presented the findings of its five-month investigation Monday morning at the United Nations. The group took issue with the structure, methods and leadership of the U.N.’s Intergovernmental Panel on Climate Change (IPCC)—the group responsible for a 2007 report that erroneously forecast the imminent melting of Himalayan glaciers, the rate of melt of polar ice caps and dwindling Amazon rainforests.
“The IPCC has raised public awareness of climate change, and driven policymakers,” said Harold Shapiro, chair of the IAC Committee to Review IPCC and former president of Princeton University. But the controversies that have erupted, and revelations of errors, have put the group under the microscope. “We recommend some significant reforms,” he told the U.N.
“The IPCC has yet to review the IAC’s findings, so I am not able to comment on its findings,” said longstanding chair Rajendra Pachauri in a press conference following the presentation. But he did note that none of the seven reviews of the IPCC to date had found flaws in the U.N. group.
“The scientific community agrees that climate change is real,” Pachauri said.
Despite his confidence, the science underlying climate change has come under great scrutiny. Yet the IAC did not spend its time analyzing the accuracy of climate models and climate science.
“We did not redo the science,” said Shapiro. Instead, the IAC focused its attention on the procedures and methodologies of the IPCC, suggesting many areas for improvement.
The rate of melt of the Himalayan glaciers was one touchstone among skeptics of manmade global warming that the group addressed. Shapiro explained that many reviewers noted the lack of substance behind the claim, but their criticism didn’t make it into the final report.
It appears that editors “didn’t follow through carefully enough on what review editors commented,” said Shapiro.
The IAC faulted the IPCC for making this type of mistake in several places, noting that the report includes several statements that are assigned high levels of confidence, Shapiro told the U.N., despite a lack of sufficient evidence behind them.
“We found in the summary for policymakers that there were two kinds of errors that came up—one is the kind where they place high confidence in something where there is very little evidence. The other is the kind where you make a statement...with no substantive value, in our judgment.”
Revising and tightening up the complex and lengthy review policy would help to address these issues.
Noted climate skeptic Don Easterbrook, an emeritus professor of geology at Western Washington University, agreed that this type of issue was a problem. “The IPCC report is filled with statements of ‘90% certainty’ without even saying 90% of what or providing any basis for such statements. Yet those pronouncements of certainty were used over and over as though that had been scientifically proven somehow,” he told FoxNews.com.
The IAC called for the IPCC to completely revise top leadership, including limiting the duration of people in top positions and “electing a small executive committee to act on its behalf,” one that even included non-scientists. This would lend it credibility, Shapiro said.
Questions have arisen about conflicts of interest among top leadership at the IPCC, notably chair Pachauri, who sits on the boards of numerous other climate-related groups. Shapiro stressed that this important issue was one the group did not investigate—“we didn’t consider it our charge to investigate that issue,” he replied.
Easterbrook thinks this suggestion may not go far enough.
“The IAC report makes several recommendations to fortify IPCCs management structure, including establishing an executive committee to act on the panels behalf and ensure that an ongoing decision-making capability is maintained. This would be a step in the right direction, but if such an executive committee is made up of the same old political cronies, nothing will change,” he told FoxNews.com.
The IAC took issue with the IPCC’s use of so-called gray literature as well, papers from unpublished or non-peer-reviewed sources. Such material is explicitly against policy, yet authors of the IPCC’s reports do not follow the guidelines for evaluating such sources, explained the IAC.
The group recommended that these guidelines be made more specific—including adding guidelines on what types of literature are unacceptable—and strictly enforced to ensure that unpublished and non-peer-reviewed literature is appropriately flagged.
The Union of Concerned Scientists, a nonprofit group that supports the concept of manmade global warming, agreed with the IAC’s report, calling it “a great opportunity to strengthen” the group, but not a wholesale call to rework the agency.
“It’s a substantial tune up, but not a replacement with a new vehicle,” Peter Frumhoff, director of science and policy for the UCS, told FoxNews.com. “All the recommendations I’ve seen are really spot on. We’ll see what happens when the IPCC meets in October.”
The IAC’s assessment will be used at the Oct. 5 meeting that marks the beginning of the IPCC’s effort to put out the next report.
“The IPCC has been successful overall, but fundamental changes are needed,” Shapiro said.
See story here.
By Dr. Tim Ball Canada Free Press
Recently Kerry Emanuel said, “Why would anybody ask weather forecasters about their opinion on climate? I think it is because there is a hope that I don’t think is justified that ordinary people will confuse weather forecasters with climate scientists.”

Emanuel is a professor of meteorology at MIT with a specialization in atmospheric convection and hurricanes. He is a meteorologist not a climatologist and many weather forecasters are meteorologists. Indeed, his specialty is even more narrow than that required by weather forecasters.
Dr. Emanuel served on the deliberately biased Lord Oxburgh committee investigating Climategate. He argued that hurricane activity would increase with global warming, but is reportedly rethinking that position. His comments were part of a 10-minute documentary about the apparently different views of media meteorologists and climatologists. He also said, “Weather forecasters are in a unique position. I mean if they actually did study the problem, if they actually took the time to really understand it rather than just go to the blogosphere to get their favourite views and rebroadcast them, then I think they could do a lot of good in the world and I think there are some who are doing that to be fair.” Dr. Emanuel served on the deliberately biased Lord Oxburgh committee investigating Climategate, the leaked emails from the Climatic Research Unit (CRU). He’s a co-author with Michael Mann and dismissed the leaks as “the well-funded “public relations campaign” to drown out or distort the message of climate science, which he links to “interests where billions, even trillions are at stake “This “machine has been highly successful in branding climate scientists as a bunch of sandal-wearing, fruit-juice drinking leftist radicals engaged in a massive conspiracy to return us to agrarian society. “Emanuel’s comments are breathtaking in their naivete, arrogance and ignorance. They’re made without challenge by mainstream media because they don’t know what is wrong with them.
Meteorology Before Climatology
The confusion is between, meteorology, weather and climate and is largely the result of how they evolved historically. Aristotle wrote a book titled Meteorology that was concerned with processes and phenomenon of the atmosphere. The intent was to understand mechanisms for weather forecasting. This declined until the 19th century when development of instruments such as the thermometer and barometer combined with a desire to measure and understand the constituents of the atmosphere. An early example was discovery of oxygen independently by Scheele in 1773 and Priestley in 1774. Physics became more dominant so that by the beginning of the 20th century it dominated meteorology. In Canada for example, to become a government weather forecaster a Masters degree in Physics was required. After which, a brief inhouse course taught weather forecasting. There was virtually no climate instruction. The pattern was similar around the world.
Even today few people know about climatology or the difference between weather and climate. When I began public speaking I started talks with a definition of climatology. First I told how, when speaking about the weather to a class studying the Fur Trade, the teacher introduced me as a climatologist. Immediately a hand went up and the young student wanted to know how many mountains I’d climbed. People laughed because it was obviously wrong, but most didn’t know the correct answer. Mark Twain knew the difference when he said climate is what you expect, weather is what you get, but for most, the weather, meteorology as physics of the atmosphere, had taken over.
Climate is derived from the Greek word klimat that refers to the angle of the Sun or inclination. They understood how this created three different climate regions, cold, temperate and hot. These were average conditions because climate is the average weather over time or in a region. The angle of the sun is a major factor in determining the climate, but it is only one of a myriad of factors. When Sir Francis Drake set out for the west coast of North America he expected to find a climate similar to that in England because it was equal in latitude so the sun’s angle was similar. They didn’t know how the ocean currents transported vast amounts of heat toward the Pole to alter the pattern of climate in Western Europe.
There was a brief flurry of interest in climate at the end of the 19th century as the concept of climatic determinism was embedded in environmental determinism. It held that people were a product of the climatic region in which they were born and lived. It reached an extreme with Ellsworth Huntington and publications like Civilization and Climate in 1915. His work evolved from Friedrich Ratzel’s Anthropogeographie published in two volumes published (1882 and 1891). All this provided an intellectual framework for white supremacy in Hitler’s Mein Kampf.
Ironically, during the war Hubert Lamb working as a meteorologist and gradually became aware of changing climate in historic times. He wanted to improve the forecasts and spent time studying historical records and by 1972 had established the Climatic Research Unit (CRU) at East Anglia. He wrote, “When the Climatic Research Unit was founded, it was clear that the first need was to establish the facts of the past record of the natural climate in times before any side effects of human activities could well be important.” Only one other climate research establishment in the world at the time was Reid Bryson’s Center for Climatic Research at Madison, Wisconsin. CRU had insufficient funds because nobody was interested in climate at that time.
A major problem was the growth of specialization in academia, but climate is a generalist topic. It’s the average weather that is the product of a multitude of factors from cosmic radiation from deep space, to geothermal heat from within the Earth, and everything in between. Meteorology is a subset of the weather like oceanography and each of these have subsets. One of them involves the specialized tropical convection and hurricane research of Emanuel. He only studies one piece of a very complex puzzle. It explains why he incorrectly predicted increased hurricane activity due to global warming. As Henri Poincare said, “Science is built of facts the way a house is built of bricks; but an accumulation of facts is no more science than a pile of bricks is a house.” Someone also said about economists that. “They try to predict the tide by measuring one wave.” Climate science does the same thing and Emanuel sides with the argument that the one wave is CO2.
See post here.
--------------
Interview on Climate Change Issues
by Kim Greenhouse on August 23, 2010
Joe D’Aleo joins us to discuss Surface Temperatures: A Policy Driven Deception, a new report that he co-wrote with Anthony Watts. Joe separates fact from fiction about CO2 and outlines its benefits and functions. Join us and learn how the EPA declared CO2 a toxin based on an analysis by a team with an agenda to control carbon and how we use energy and energy sources. Listen to this one hour interview here.
UPDATE: In a program “Green Swindle” devoted to exposing the roots of the global warming scandal, Sean Hannity featured many climate skeptics on his Fox News program - part 1 here, part 2 here. 500,000 to some estimate as many as 2 million descended on Washington, D.C. for the 8-28-10 Restoring Honor Rally, CSPAN televised the event.

The event was streamed live via Facebook. It was a very uplifting event. Beck like Hannity have shown how the global warming issue is a fraud and how it evolved and who are involved. There was no politics at the rally though. It was all restoring traditional American values and pride in our heritage.
------------
Ice Sheet Loss Cut in Half
By Doug Hoffman
Much concern has been raised by climate scientists regarding ice loss from the world’s two remaining continental ice sheets. Rapid loss of ice-mass from the glaciers of Greenland and Antarctica are cited as proof positive of global warming’s onslaught. The latest measurements involve the use of satellite gravimetry, estimating the mass of terrain beneath by detecting slight changes in gravity as a satellite passes overhead. But gravity measurements of ice-mass loss are complicated by glacial isostatic adjustments - compensation for the rise or fall of the underlying crustal material. A new article in Nature Geoscience describes an innovative approach employed to derive ice-mass changes from GRACE data. The report suggests significantly smaller overall ice-mass losses than previous estimates.
The storage of water or ice on land - the presence of large bodies of water or glacial ice sheets - affect the Earth’s gravitational field. This effect is detected by the NASA Gravity Recovery and Climate Experiment (GRACE) satellites. Twin satellites were launched in March 2002, to make detailed measurements of Earth’s gravity field. Since then, GRACE has been used to study tectonic features, estimate ground water volumes and calculate the amount of ice contained in the Greenland and Antarctica ice sheets. However, other factors can contribute to the GRACE measurements than just the volume of ice in an ice sheet. These factors include the response of Earth’s crust (the lithosphere) to past changes in ice load.
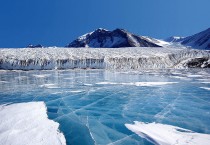
Antarctica was found to be rising, but not as fast as previously thought.
As the weight of covering ice varies, the underlying surface rock can be pushed down or rise up, buoyed by the magma that the crust floats on. This would obviously impact efforts to measure the height of terrain, including glaciers. Compensating for the rise and fall of bedrock is termed glacial isostatic adjustment, and it can have a significant impact on estimated ice-mass losses. Changes in the spatial distribution of the atmospheric and oceanic masses can also enter into the picture. Correctly assessing these different factors is the key to accurately calculating ice-sheet mass balance. Xiaoping Wu and colleagues have proposed a new method for untangling these factors from GRACE measurements. In a News and Views commentary on the work by Wu et al., David H. Bromwich and Julien P. Nicolas sum up the problem:
The atmospheric and oceanic contributions are commonly derived from global reanalyses or other global climate models that assimilate observations. However, the contribution from glacial isostatic adjustment is more difficult to evaluate because the Earth’s mantle is viscoelastic and therefore responds to changes in surface loading with a long delay. Indeed, the variations of the mass and extent of the ice sheets since the Last Glacial Maximum, about 20,000 years ago, continue to affect present-day changes in bedrock elevation. Assessments of the glacial isostatic adjustment typically rely on deglaciation models - which simulate the evolution of the ice sheets since the Last Glacial Maximum - together with assumptions about the viscosity profile of the mantle. Much is still unknown regarding the history of the ice sheets, and even less is known about the behaviour of the mantle in response to loading and unloading.
The method used by Wu et al., in “Simultaneous estimation of global present-day water transport and glacial isostatic adjustment,” estimates ice-mass changes and glacial isostatic adjustment simultaneously, instead of estimating the latter separately from deglaciation models as had been done before. The problem is expressed in terms of a single matrix equation, with the observed surface-height changes decomposed into their different contributions. The equation is then solved for ice-mass changes using matrix inversion. While the glacial isostatic adjustment that results is not directly generated by deglaciation models, the inversion method still requires a first-guess estimate to begin the calculations.
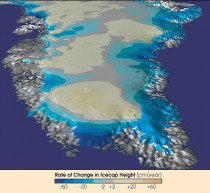
Ice loss in Greenland has been significantly overestimated.
In describing their work, Wu et al. state: “Here we combine gravity measurements and geodetic data of surface movement with a data-assimilating model of ocean bottom pressure to simultaneously estimate present-day water transport and glacial isostatic adjustment. We determine their separate contributions to movements in the geocentre, which occur in response to changes in the Earth’s mass distribution, with uncertainties below 0.1 mm yr−1.” They further describe their methodology as follows:
From April 2002 to December 2008, linear trends are derived from GRACE gravity data with empirically calibrated full covariance matrices, and from the Jet Propulsion Laboratory’s data-assimilating ocean bottom pressure (OBP) model. These are combined with three-dimensional surface velocities at 664 globally distributed sites. Although the durations of the surface geodetic time series are diverse, most of the data are collected by the global positioning system (GPS) technique during the 2000s and processed up to August 2007. Spherical harmonic coefficients of both PDMT and GIA signatures as well as other relevant parameters are then estimated from the data combination.
Here PDMT stands for present-day surface mass trend and GIA for glacial isostatic adjustment. Those interested in the theoretical framework - including the relevant measurement equations, data sets and uncertainty assessment - should look in the Methods section of the paper and the Supplementary Information pdf.
What is really interesting here is the resulting trend data for the change of bedrock height - the geoid height trend. The new method found that estimates used in the past were significantly in error. Antarctica was found to be rising, but not at as fast a rate as previously thought. Greenland, on the other hand, is actually sinking, particularly in the center of the ice sheet. Previous change estimates had Greenland rising everywhere.
“The negative GIA geoid trend in Greenland could be new evidence for additional net past ice accumulation (-100300 m of ice depending on rheological properties and onset time) in comparison with the a priori model,”
the researchers state, noting that past accumulation over certain parts of Greenland has been suggested before by other models. The study results can be seen in the figure below, taken from the report.
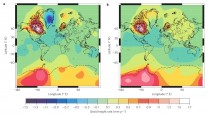
Unfiltered GIA geoid height trends.
In the figure a, shows rates estimated in the study, and b,those predicted by the ICE-5G/IJ05/VM2 model. While Wu et al. report that both Greenland and Antarctica are loosing ice-mass, they are doing so at a much lower rate than previous estimates and that both are gaining ice in their interiors. “The mass loss in Greenland is concentrated along the coastal areas, and is particularly heavy in the west, and in the southeast with the large Kangerdlugssuaq and Helheim glaciers,” they state. “In contrast, the interior of Greenland shows significant positive mass balance.”
Bottom line on the new work is that ice-mass loss has been overestimated by previous studies. “These findings confirm the ongoing shrinkage of the polar ice sheets,” state Bromwich and Nicolas. “However, and most importantly, the newly estimated ice-sheet mass losses represent less than half of other recent GRACE-based estimates for the same time interval: -230 +/- 33 Gt yr-1 for Greenland2 and -132 +/- 26 Gt yr-1 for West Antarctica.” According to Wu et al. “We conclude that a significant revision of the present estimates of glacial isostatic adjustments and landocean water exchange is required.” Perhaps this technique could be applied to the previous GRACE results for Himalayan glaciers as well.
So, when the more exact measurement separation methodology of Wu et al. is applied to the GRACE geoid data, ice sheet shrinkage, which has been systematically overestimated, is cut in half. “The differences between the work by Wu and colleagues and earlier studies may reflect errors in present deglaciation models with respect to the ice-load history and response of the Earth’s mantle,” conclude Bromwich and Nicolas. According to Wu et al.
“significant revision” is required. The general result - the Greenland and Antarctica ice sheets will be with us for a long time to come. See post here.
See Al Gore’s take on this based on the Liu and Curry 2010 model here that predicts future loss. See Bob Tisdale’s analysis here.